
Loss of momentum tempers Toncoin rally even as gains extend for the week

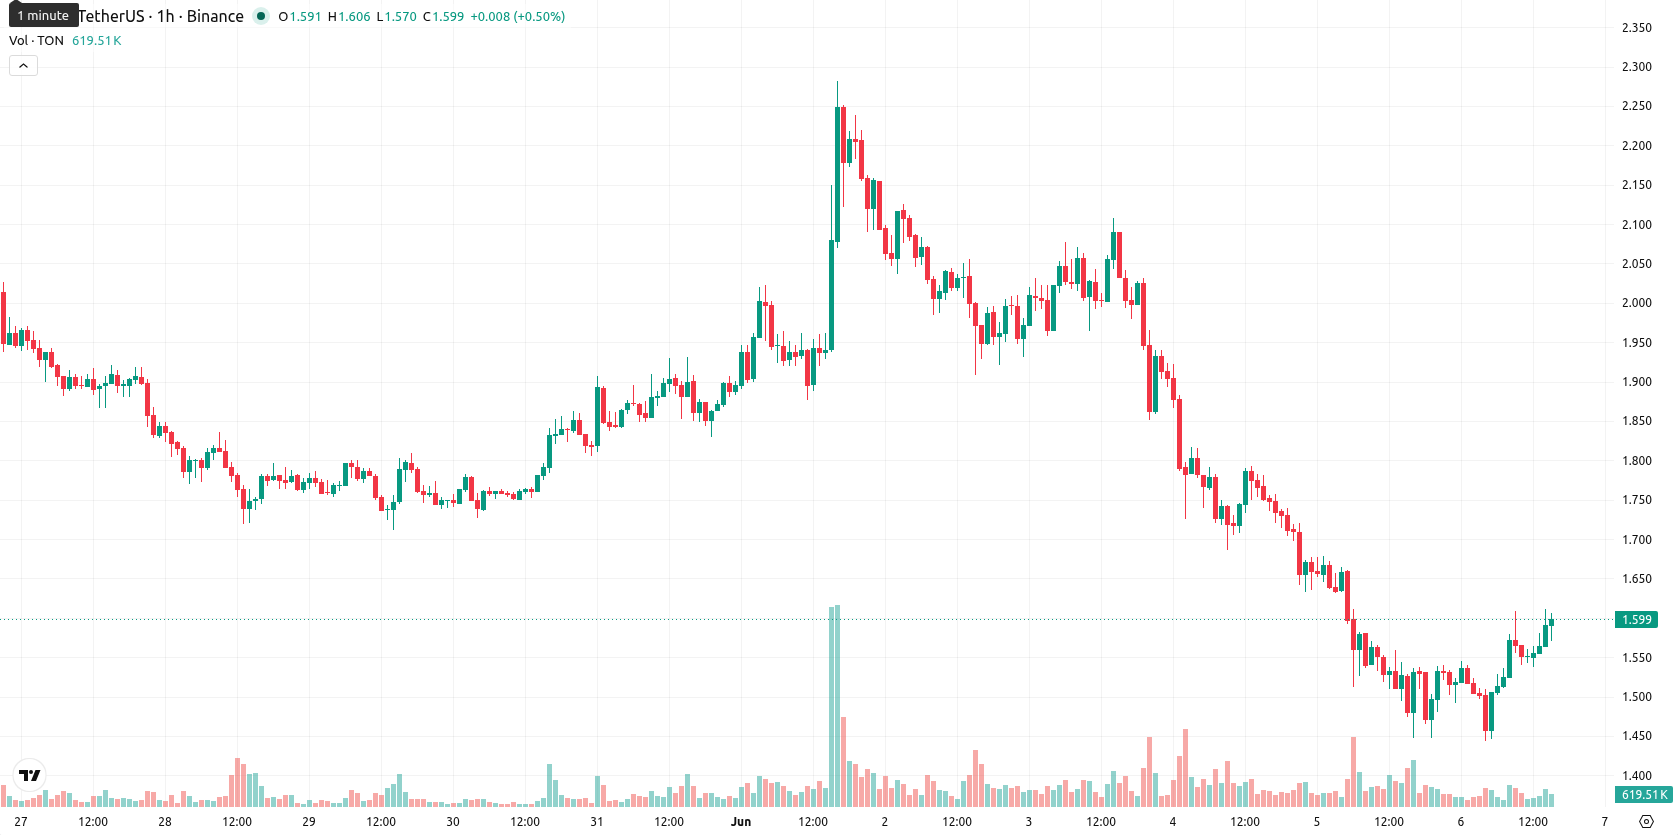
Toncoin (TON) is trading at $1.601, up 7.74% for the day. The asset sits above its key moving averages, highlighting persistent bullish momentum despite recent volatility.
 1.467
1.6520
1.467
1.6520
Highlights
- TON blockchain outages from failed sharding protocol upgrades triggered widespread mini-app shutdowns, undermining core network operations and trust.
- Network congestion and dApp disruptions diminished user activity and token demand, compounding fundamental pressures despite persistent volatility.
- TON/USD remains in a bullish structure above key moving averages, but overbought oscillators and mixed momentum warn of short-term consolidation within the $1.415–$1.787 range.
Network outages challenge utility as protocol changes fuel volatility
Toncoin is experiencing market turbulence after major infrastructure failures in The Open Network (TON) blockchain triggered outages across key mini-apps and network portals. These disruptions, tied to recent sharding protocol changes, have led to significant synchronization issues and congestion, undermining the utility and stability of the network. The broad shutdown of decentralized applications and ecosystem pages has decreased user engagement and fundamental demand for TON tokens. Despite these challenges, price action reflects high volatility as traders respond to ongoing technical risks.
Mixed signals warn of exhaustion as oscillators turn overbought
On the technical front, TON/USD continues to trade above the 20- and 50-period moving averages on the hourly chart and above the 200-period moving average on the daily timeframe. Immediate support is defined by the Ichimoku Kijun line at $1.527. Momentum signals are mixed: the MACD is neutral, and the ADX points to a potential loss of trend strength. While the RSI holds in buy territory without hitting overbought conditions, both Stoch RSI and CCI are overbought, flagging exhaustion risk. BBP shows ongoing buyer dominance intraday, and the Awesome Oscillator supports the current move upward. However, the divergence between overbought oscillators and neutral-to-mixed momentum indicators cautions that upside may be limited in the near term.
Consolidation expected as upside hinges on volatility breakout
Over the next two to three trading days, the forecasted range for TON/USD is $1.415 to $1.787, representing a volatility band relative to current levels. The baseline scenario anticipates consolidation within this corridor, with a 52% probability assigned to additional gains. Should the price break above the upper boundary, a bullish scenario materializes with further upside potential, while a decisive move below immediate support could accelerate declines toward the lower end of the forecasted range.
Earlier, analysts noted that Toncoin was under sustained bearish pressure due to persistent selling momentum and weak technical signals. This latest phase of volatility, following network infrastructure failures but accompanied by a recovery above major moving averages, adds a new layer of risk and suggests traders should monitor whether bullish momentum can absorb further fundamental shocks in the coming sessions.







-
 Afghanistan
-
 Albania
-
 Algeria
-
 Angola
-
 Argentina
-
 Armenia
-
 Australia
-
 Austria
-
 Azerbaijan
-
 Bahamas
-
 Bahrain
-
 Bangladesh
-
 Belarus
-
 Belgium
-
 Bolivia
-
 Botswana
-
 Brazil
-
 Brunei
-
 Bulgaria
-
 Cambodia
-
 Cameroon
-
 Canada
-
 Chile
Chile
-
 China
China
-
 Colombia
-
 Congo
Congo
-
 Costa Rica
-
 Cote d'Ivoire
-
 Croatia
-
 Cuba
Cuba
-
 Cyprus
-
 Czechia
-
 DR Congo
-
 Denmark
-
 Dominican Republic
-
 Ecuador
-
 Egypt
Egypt
-
 El Salvador
-
 Estonia
-
 Eswatini
-
 Ethiopia
-
 Finland
-
 France
-
 Georgia
-
 Germany
-
 Ghana
Ghana
-
 Greece
-
 Haiti
Haiti
-
 Hong Kong
-
 Hungary
-
 India
India
-
 Indonesia
-
 Iran, Islamic republic
-
 Iraq
Iraq
-
 Ireland
-
 Israel
-
 Italy
Italy
-
 Jamaica
-
 Japan
Japan
-
 Jordan
-
 Kazakhstan
-
 Kenya
Kenya
-
 Korea
Korea
-
 Kuwait
-
 Kyrgyzstan
-
 Laos
Laos
-
 Latvia
-
 Lebanon
-
 Lesotho
-
 Libya
Libya
-
 Lithuania
-
 Luxembourg
-
 Madagascar
-
 Malaysia
-
 Malta
Malta
-
 Mauritius
-
 Mexico
-
 Moldova
-
 Mongolia
-
 Montenegro
-
 Morocco
-
 Mozambique
-
 Myanmar
-
 Namibia
-
 Nepal
Nepal
-
 Netherlands
-
 New Zealand
-
 Nigeria
-
 North Macedonia
-
 Norway
-
 Oman
Oman
-
 Pakistan
-
 Palestine
-
 Panama
-
 Papua New Guinea
-
 Paraguay
-
 Peru
Peru
-
 Philippines
-
 Poland
-
 Portugal
-
 Puerto Rico
-
 Qatar
Qatar
-
 Reunion
-
 Romania
-
 Rwanda
-
 Saudi Arabia
-
 Serbia
-
 Singapore
-
 Slovakia
-
 Slovenia
-
 Somalia
-
 South Africa
-
 Spain
Spain
-
 Sri Lanka
-
 Sweden
-
 Switzerland
-
 Syria
Syria
-
 Taiwan
-
 Tajikistan
-
 Tanzania
-
 Thailand
-
 Trinidad and Tobago
-
 Tunisia
-
 Turkey
-
 UAE
UAE
-
 Uganda
-
 Ukraine
-
 United Kingdom
-
United States
-
 Uruguay
-
 Uzbekistan
-
 Venezuela
-
 Vietnam
-
 Yemen
Yemen
-
 Zambia
-
 Zimbabwe
- Forex
- Crypto











