
XRP slides within recent $1.05–$1.16 range as bearish momentum prevails: weekly analysis

XRP is currently trading at $1.1073, marking a weekly drop of $0.1353 (11.00%) over the last seven days. The price remains below its weekly MA-20 ($1.3728), MA-50 ($2.0734), and MA-200 ($1.1934) averages, signaling sustained bearish momentum and positioning XRP in the lower range of its recent price channel.
Highlights
- XRP remains firmly in a bearish trend as it trades below major moving averages, with sellers maintaining control.
- Weekly momentum indicators show persistent weakness, including oversold conditions and negative readings across all key signals.
- XRP is projected to trade between $1.05 and $1.16 over the next week, with a higher probability of continued downside.
Network upgrade and capitulation pressures drive sentiment this week
The XRP Ledger is set for a major upgrade with version 3.2.0 scheduled for rollout on June 15, which aims to boost network efficiency, reduce infrastructure costs, and accelerate transaction settlement. Recent Glassnode data shows notable capitulation among holders, as the realized profit-to-loss ratio for XRP has fallen to 0.38 over the past 90 days and network fees dropped 91.5% from 2025 highs. Participants are encouraged to test the upcoming upgrade on testnet or devnet to ensure a smooth transition.
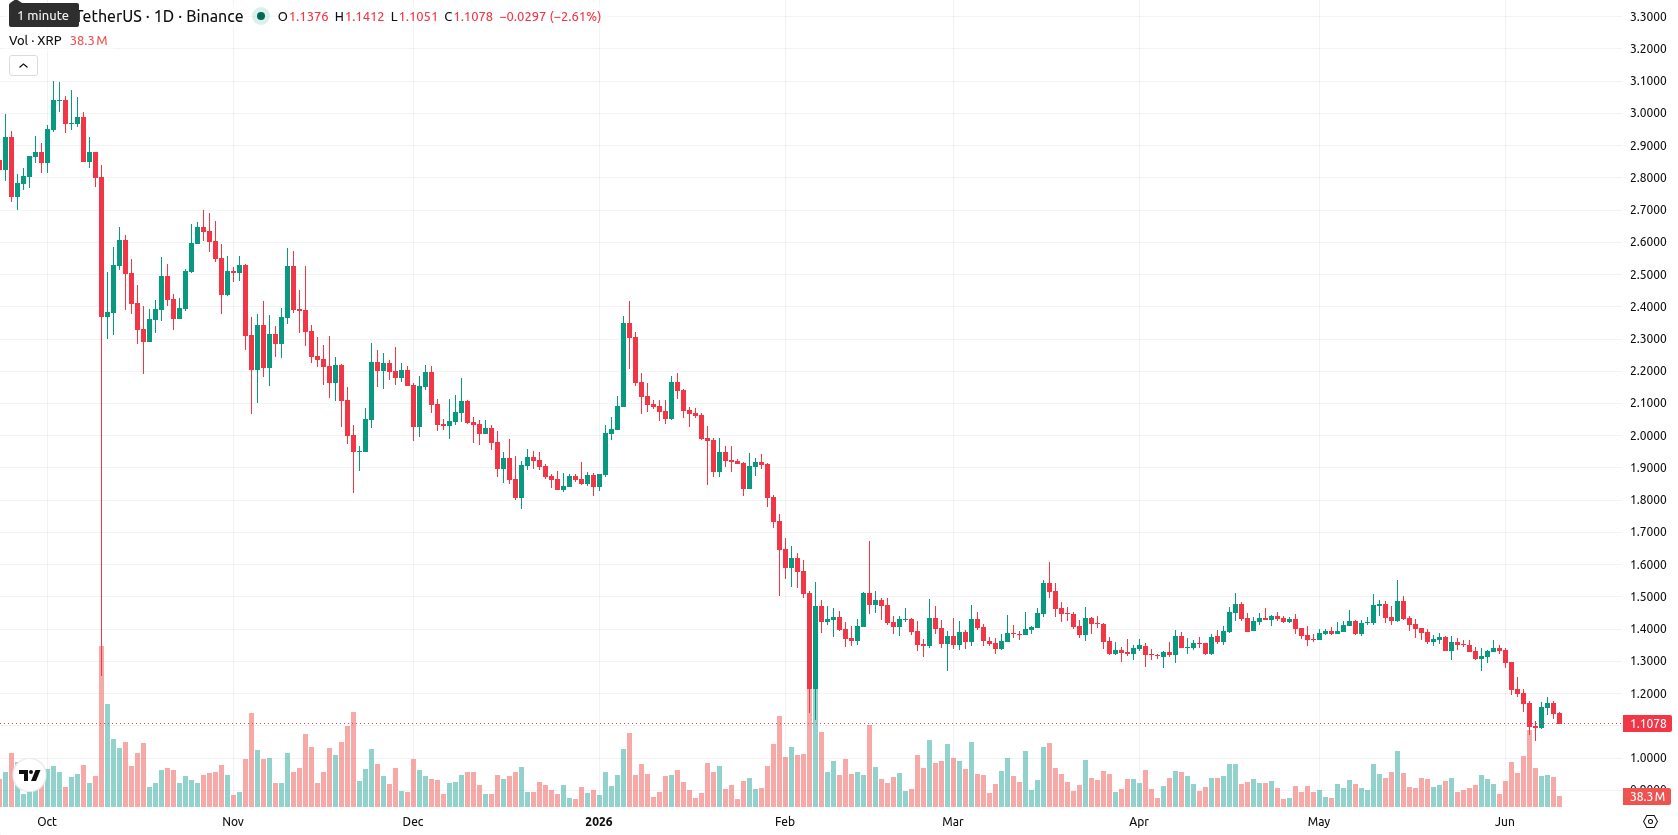
Bearish indicators persist as price holds below resistance all week
Weekly technical indicators for XRP continue to point toward a bearish outlook, with the price holding below key weekly moving averages (MA-20, MA-50, and MA-200). The closest dynamic resistance sits near the MA-20 at $1.3728. Support is observed at $1.05 and resistance at $1.16. Weekly RSI remains just above 30, confirming bearish momentum alongside a Strong Sell from the MACD, negative Bull/Bear Power, and oversold signals from the Stochastic RSI and CCI. The Awesome Oscillator aligns with the prevailing downtrend, and ADX supports the current seller dominance.
Continued downside risk as high volatility constrains reversal prospects
For the next 7 days, XRP is expected to trade within a $1.05 to $1.16 range, reflecting high weekly volatility and strong bearish signals on the W1 timeframe. Oversold readings may limit further declines, but the probability of a reversal is very low, with indicators showing no signs of buying interest. Baseline scenario: XRP oscillates sideways around current prices as sellers remain in control. A bullish scenario would require a breakout above $1.16 to test resistance near $1.19, while a bearish scenario could see a drop below $1.05, leading to new lows.
Earlier, analysts noted that XRP was exhibiting persistent bearish momentum amid widespread selling pressure and investor capitulation. The current technical outlook reinforces this negativity, with sustained downside risk and high volatility suggesting that a decisive move below $1.05 could trigger a new phase of losses.


-
 Afghanistan
-
 Albania
-
 Algeria
-
 Angola
-
 Argentina
-
 Armenia
-
 Australia
-
 Austria
-
 Azerbaijan
-
 Bahamas
-
 Bahrain
-
 Bangladesh
-
 Belarus
-
 Belgium
-
 Bolivia
-
 Botswana
-
 Brazil
-
 Brunei
-
 Bulgaria
-
 Cambodia
-
 Cameroon
-
 Canada
-
 Chile
Chile
-
 China
China
-
 Colombia
-
 Congo
Congo
-
 Costa Rica
-
 Cote d'Ivoire
-
 Croatia
-
 Cuba
Cuba
-
 Cyprus
-
 Czechia
-
 DR Congo
-
 Denmark
-
 Dominican Republic
-
 Ecuador
-
 Egypt
Egypt
-
 El Salvador
-
 Estonia
-
 Eswatini
-
 Ethiopia
-
 Finland
-
 France
-
 Georgia
-
 Germany
-
 Ghana
Ghana
-
 Greece
-
 Haiti
Haiti
-
 Hong Kong
-
 Hungary
-
 India
India
-
 Indonesia
-
 Iran, Islamic republic
-
 Iraq
Iraq
-
 Ireland
-
 Israel
-
 Italy
Italy
-
 Jamaica
-
 Japan
Japan
-
 Jordan
-
 Kazakhstan
-
 Kenya
Kenya
-
 Korea
Korea
-
 Kuwait
-
 Kyrgyzstan
-
 Laos
Laos
-
 Latvia
-
 Lebanon
-
 Lesotho
-
 Libya
Libya
-
 Lithuania
-
 Luxembourg
-
 Madagascar
-
 Malaysia
-
 Malta
Malta
-
 Mauritius
-
 Mexico
-
 Moldova
-
 Mongolia
-
 Montenegro
-
 Morocco
-
 Mozambique
-
 Myanmar
-
 Namibia
-
 Nepal
Nepal
-
 Netherlands
-
 New Zealand
-
 Nigeria
-
 North Macedonia
-
 Norway
-
 Oman
Oman
-
 Pakistan
-
 Palestine
-
 Panama
-
 Papua New Guinea
-
 Paraguay
-
 Peru
Peru
-
 Philippines
-
 Poland
-
 Portugal
-
 Puerto Rico
-
 Qatar
Qatar
-
 Reunion
-
 Romania
-
 Rwanda
-
 Saudi Arabia
-
 Serbia
-
 Singapore
-
 Slovakia
-
 Slovenia
-
 Somalia
-
 South Africa
-
 Spain
Spain
-
 Sri Lanka
-
 Sweden
-
 Switzerland
-
 Syria
Syria
-
 Taiwan
-
 Tajikistan
-
 Tanzania
-
 Thailand
-
 Trinidad and Tobago
-
 Tunisia
-
 Turkey
-
 UAE
UAE
-
 Uganda
-
 Ukraine
-
 United Kingdom
-
United States
-
 Uruguay
-
 Uzbekistan
-
 Venezuela
-
 Vietnam
-
 Yemen
Yemen
-
 Zambia
-
 Zimbabwe
- Forex
- Crypto
