
Curve price prediction: Can $0.2655 resistance hold as CRV gains 23.22%?

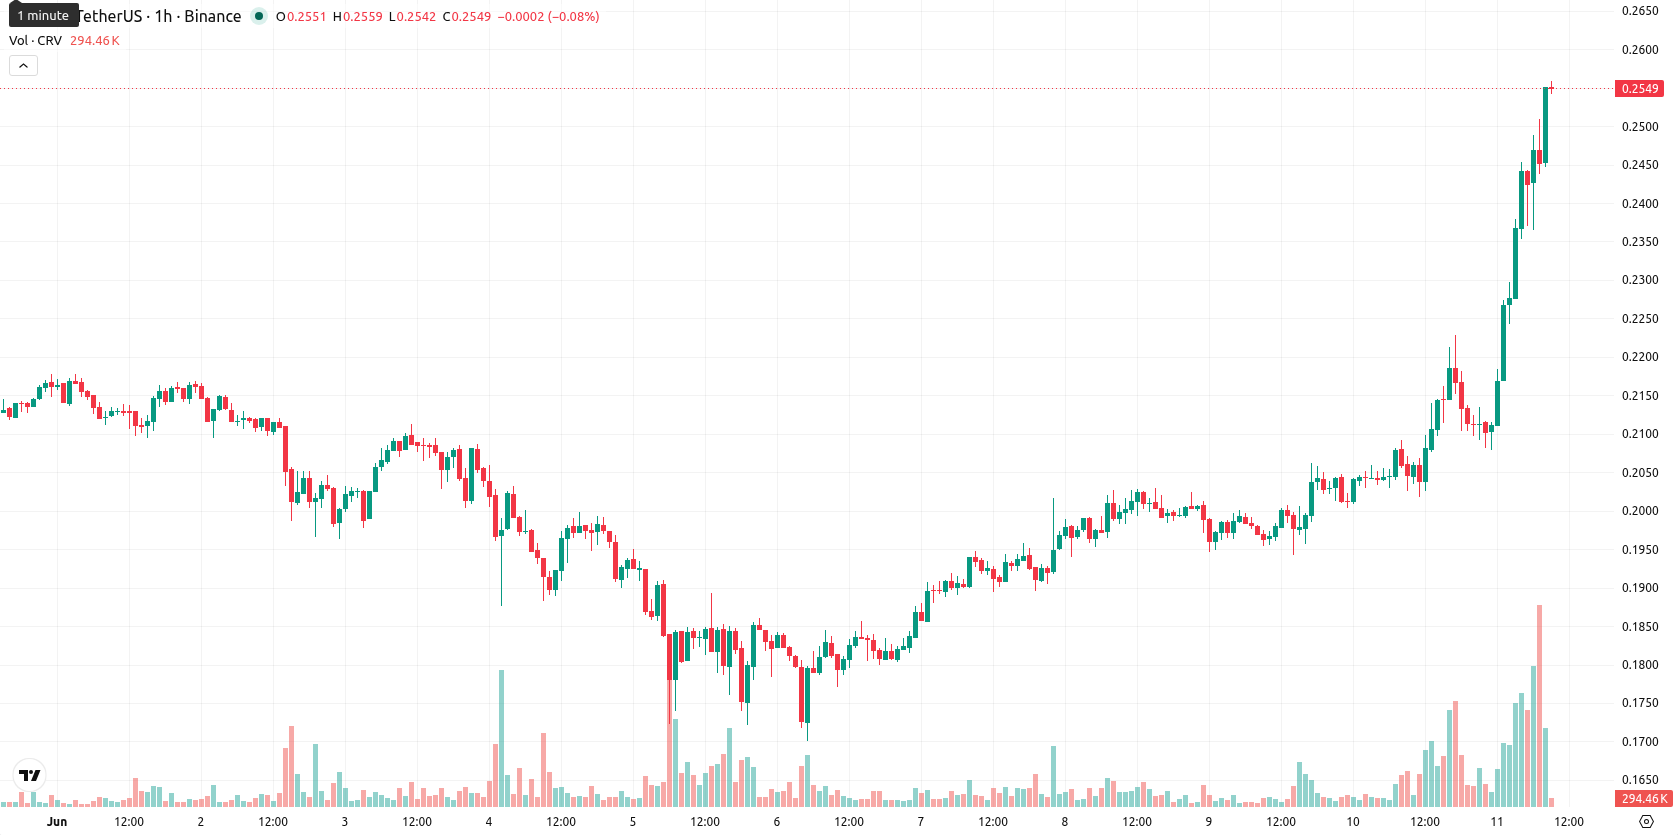
Curve (CRV) is trading at $0.2537, up 23.22% on the day. The price sits above its short- and medium-term moving averages while remaining below its longer-term trend averages.
Highlights
- Curve expanded its lending protocol with Llamalend v2 on Optimism, enabling broader LP token-backed loans and boosting protocol utility.
- CRV futures trading volume exceeded $190 million alongside a 23% spike in open interest, reflecting heightened derivatives engagement.
- CRV/USD shows strong near-term bullish momentum with overbought conditions, forecast to consolidate between $0.2341 and $0.2655 over the next few days.
Derivatives surge and protocol expansion drive renewed token demand
Curve’s recent launch of Llamalend v2 on Optimism marks a significant strategic expansion, immediately broadening the protocol’s lending markets to facilitate LP token-backed loans beyond just crvUSD. This product rollout increases the utility and attractiveness of Curve for DeFi users, directly enhancing demand for the protocol’s services and underlying token. Supporting this momentum, CRV futures trading volume surged above $190 million, with open interest climbing over 23% to $76 million, reflecting intensified derivatives activity and heightened market engagement.
Strong momentum signals as price nears key resistance threshold
On the technical chart, CRV is trading above the MA-20 ($0.2221) and MA-50 ($0.2100) on the H1 timeframe, but remains below the MA-200 ($0.2876) on the daily chart. The Ichimoku Kijun at $0.2264 is acting as immediate support. Momentum indicators show strong buying signals—both MACD and ADX are in Buy mode, with the RSI elevated at 83.91. CCI and Stoch RSI also indicate overbought conditions, as do Bull/Bear Power and the Awesome Oscillator, highlighting strong yet potentially overextended upward momentum.
Range-bound trading outlook as breakout and pullback risks rise
Over the next 2-3 trading days, CRV/USD is expected to trade within a typical volatility band between $0.2341 and $0.2655. The baseline scenario is a sideways consolidation within this range. If the price breaks above $0.2655, a continuation of short-term gains is likely, while a drop below the immediate support at $0.2264 could signal a pullback.
Earlier, analysts noted that while Curve was showing signs of short-term bullish momentum, the sustainability of its rally was uncertain due to persistent technical divergence and volatility. With current developments underscoring both increased market activity and overextension signals, traders should monitor for a potential breakout above the $0.2655 resistance as confirmation of further gains or be alert for a reversal if price closes below immediate support.


Latest Curve News


-
 Afghanistan
-
 Albania
-
 Algeria
-
 Angola
-
 Argentina
-
 Armenia
-
 Australia
-
 Austria
-
 Azerbaijan
-
 Bahamas
-
 Bahrain
-
 Bangladesh
-
 Belarus
-
 Belgium
-
 Bolivia
-
 Botswana
-
 Brazil
-
 Brunei
-
 Bulgaria
-
 Cambodia
-
 Cameroon
-
 Canada
-
 Chile
Chile
-
 China
China
-
 Colombia
-
 Congo
Congo
-
 Costa Rica
-
 Cote d'Ivoire
-
 Croatia
-
 Cuba
Cuba
-
 Cyprus
-
 Czechia
-
 DR Congo
-
 Denmark
-
 Dominican Republic
-
 Ecuador
-
 Egypt
Egypt
-
 El Salvador
-
 Estonia
-
 Eswatini
-
 Ethiopia
-
 Finland
-
 France
-
 Georgia
-
 Germany
-
 Ghana
Ghana
-
 Greece
-
 Haiti
Haiti
-
 Hong Kong
-
 Hungary
-
 India
India
-
 Indonesia
-
 Iran, Islamic republic
-
 Iraq
Iraq
-
 Ireland
-
 Israel
-
 Italy
Italy
-
 Jamaica
-
 Japan
Japan
-
 Jordan
-
 Kazakhstan
-
 Kenya
Kenya
-
 Korea
Korea
-
 Kuwait
-
 Kyrgyzstan
-
 Laos
Laos
-
 Latvia
-
 Lebanon
-
 Lesotho
-
 Libya
Libya
-
 Lithuania
-
 Luxembourg
-
 Madagascar
-
 Malaysia
-
 Malta
Malta
-
 Mauritius
-
 Mexico
-
 Moldova
-
 Mongolia
-
 Montenegro
-
 Morocco
-
 Mozambique
-
 Myanmar
-
 Namibia
-
 Nepal
Nepal
-
 Netherlands
-
 New Zealand
-
 Nigeria
-
 North Macedonia
-
 Norway
-
 Oman
Oman
-
 Pakistan
-
 Palestine
-
 Panama
-
 Papua New Guinea
-
 Paraguay
-
 Peru
Peru
-
 Philippines
-
 Poland
-
 Portugal
-
 Puerto Rico
-
 Qatar
Qatar
-
 Reunion
-
 Romania
-
 Rwanda
-
 Saudi Arabia
-
 Serbia
-
 Singapore
-
 Slovakia
-
 Slovenia
-
 Somalia
-
 South Africa
-
 Spain
Spain
-
 Sri Lanka
-
 Sweden
-
 Switzerland
-
 Syria
Syria
-
 Taiwan
-
 Tajikistan
-
 Tanzania
-
 Thailand
-
 Trinidad and Tobago
-
 Tunisia
-
 Turkey
-
 UAE
UAE
-
 Uganda
-
 Ukraine
-
 United Kingdom
-
United States
-
 Uruguay
-
 Uzbekistan
-
 Venezuela
-
 Vietnam
-
 Yemen
Yemen
-
 Zambia
-
 Zimbabwe
- Forex
- Crypto
