
Bitcoin climbs after Iran moves forward with Bitcoin-settled trade platforms

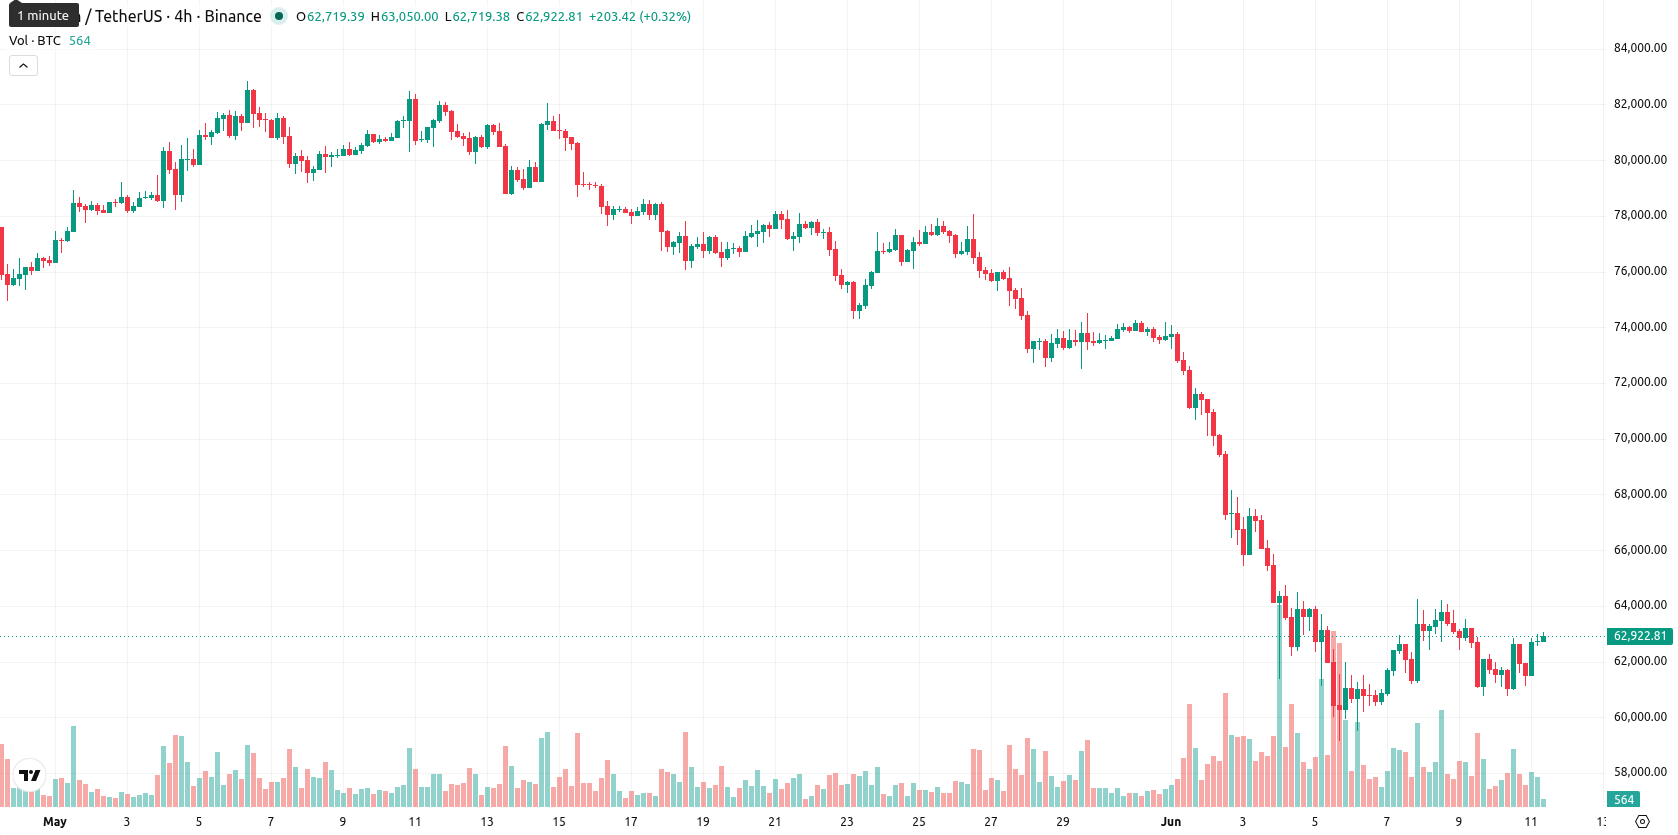
Bitcoin (BTC) is trading at $62,944.01, up 2.72% on the day. The price is situated above its key moving averages, reflecting renewed short- and medium-term buying interest.
Highlights
- US military strikes on Iranian targets and $1 billion in crypto liquidations have sharply raised geopolitical risk and market volatility.
- US Treasury sanctions targeting Nobitex and Iran’s Strait of Hormuz closure are squeezing Bitcoin global liquidity and increasing compliance uncertainty.
- Bitcoin trades in a choppy range, with key support near $62,490 and a projected range of $59,487.73–$65,226.49, as indicators lean slightly bearish.
Bitcoin volatility rises as US-Iran tensions drive liquidations
US military strikes against Iranian targets, reported by Cryptobriefing.com, have spurred a direct escalation in geopolitical risk that is rippling through digital asset markets. The aftermath has seen approximately $1 billion in crypto liquidations, highlighting heightened volatility and forced selling that amplifies market pressure on Bitcoin. Additional factors such as Iran’s closure of the Strait of Hormuz and newly imposed US Treasury sanctions against Nobitex, Iran’s largest cryptocurrency exchange, are further constraining global accessibility and liquidity for Bitcoin, while Iran’s push for Bitcoin-settled trade platforms points to evolving state-driven demand under greater compliance risk.
Mixed momentum and diverging signals as BTC tests technical levels
BTC/USD is trading above the 20- and 50-period moving averages on the H4 timeframe but remains below the 200-period moving average, signaling conflicting trend strength at different timeframes. The Ichimoku Kijun line at $62,490.34 now acts as immediate support for short-term price action. Momentum readings are mixed: MACD and ADX both show a sell bias, while RSI at 51.42 gives a buy signal and Stoch RSI is overbought, pointing to stretched short-term conditions. CCI is neutral, BBP is overbought and indicates strong intraday buyer dominance, while the Awesome Oscillator signals a strong buy and supports upward intraday action. Volatility remains moderate, and session price is near its daily high, but momentum and oscillator signals show notable divergence and choppy conditions.
Modest downside risk prevails as price faces defined range
For the next several days, the typical volatility band is expected between $59,487.73 and $65,226.49. Downside moves are slightly more likely, with probability for further upside at 45% versus 55% for a decline. A baseline scenario favors range trading within these levels; a clear bullish scenario opens if BTC/USD breaks above recent resistance, while a bearish outcome is likely if price falls below the Ichimoku Kijun and local support.
Earlier, analysts noted that Bitcoin’s price sensitivity is closely linked to shifts in macroeconomic and liquidity conditions rather than serving as a classic inflation hedge. The latest surge in geopolitical tensions and tightening regulatory actions introduces fresh downside risks, making it essential for traders to monitor whether BTC can maintain support above the Ichimoku Kijun line to avoid an extended drawdown.


-
 Afghanistan
-
 Albania
-
 Algeria
-
 Angola
-
 Argentina
-
 Armenia
-
 Australia
-
 Austria
-
 Azerbaijan
-
 Bahamas
-
 Bahrain
-
 Bangladesh
-
 Belarus
-
 Belgium
-
 Bolivia
-
 Botswana
-
 Brazil
-
 Brunei
-
 Bulgaria
-
 Cambodia
-
 Cameroon
-
 Canada
-
 Chile
Chile
-
 China
China
-
 Colombia
-
 Congo
Congo
-
 Costa Rica
-
 Cote d'Ivoire
-
 Croatia
-
 Cuba
Cuba
-
 Cyprus
-
 Czechia
-
 DR Congo
-
 Denmark
-
 Dominican Republic
-
 Ecuador
-
 Egypt
Egypt
-
 El Salvador
-
 Estonia
-
 Eswatini
-
 Ethiopia
-
 Finland
-
 France
-
 Georgia
-
 Germany
-
 Ghana
Ghana
-
 Greece
-
 Haiti
Haiti
-
 Hong Kong
-
 Hungary
-
 India
India
-
 Indonesia
-
 Iran, Islamic republic
-
 Iraq
Iraq
-
 Ireland
-
 Israel
-
 Italy
Italy
-
 Jamaica
-
 Japan
Japan
-
 Jordan
-
 Kazakhstan
-
 Kenya
Kenya
-
 Korea
Korea
-
 Kuwait
-
 Kyrgyzstan
-
 Laos
Laos
-
 Latvia
-
 Lebanon
-
 Lesotho
-
 Libya
Libya
-
 Lithuania
-
 Luxembourg
-
 Madagascar
-
 Malaysia
-
 Malta
Malta
-
 Mauritius
-
 Mexico
-
 Moldova
-
 Mongolia
-
 Montenegro
-
 Morocco
-
 Mozambique
-
 Myanmar
-
 Namibia
-
 Nepal
Nepal
-
 Netherlands
-
 New Zealand
-
 Nigeria
-
 North Macedonia
-
 Norway
-
 Oman
Oman
-
 Pakistan
-
 Palestine
-
 Panama
-
 Papua New Guinea
-
 Paraguay
-
 Peru
Peru
-
 Philippines
-
 Poland
-
 Portugal
-
 Puerto Rico
-
 Qatar
Qatar
-
 Reunion
-
 Romania
-
 Rwanda
-
 Saudi Arabia
-
 Serbia
-
 Singapore
-
 Slovakia
-
 Slovenia
-
 Somalia
-
 South Africa
-
 Spain
Spain
-
 Sri Lanka
-
 Sweden
-
 Switzerland
-
 Syria
Syria
-
 Taiwan
-
 Tajikistan
-
 Tanzania
-
 Thailand
-
 Trinidad and Tobago
-
 Tunisia
-
 Turkey
-
 UAE
UAE
-
 Uganda
-
 Ukraine
-
 United Kingdom
-
United States
-
 Uruguay
-
 Uzbekistan
-
 Venezuela
-
 Vietnam
-
 Yemen
Yemen
-
 Zambia
-
 Zimbabwe
- Forex
- Crypto
