
+4.17% for Jupiter as bulls maintain control above trend lines

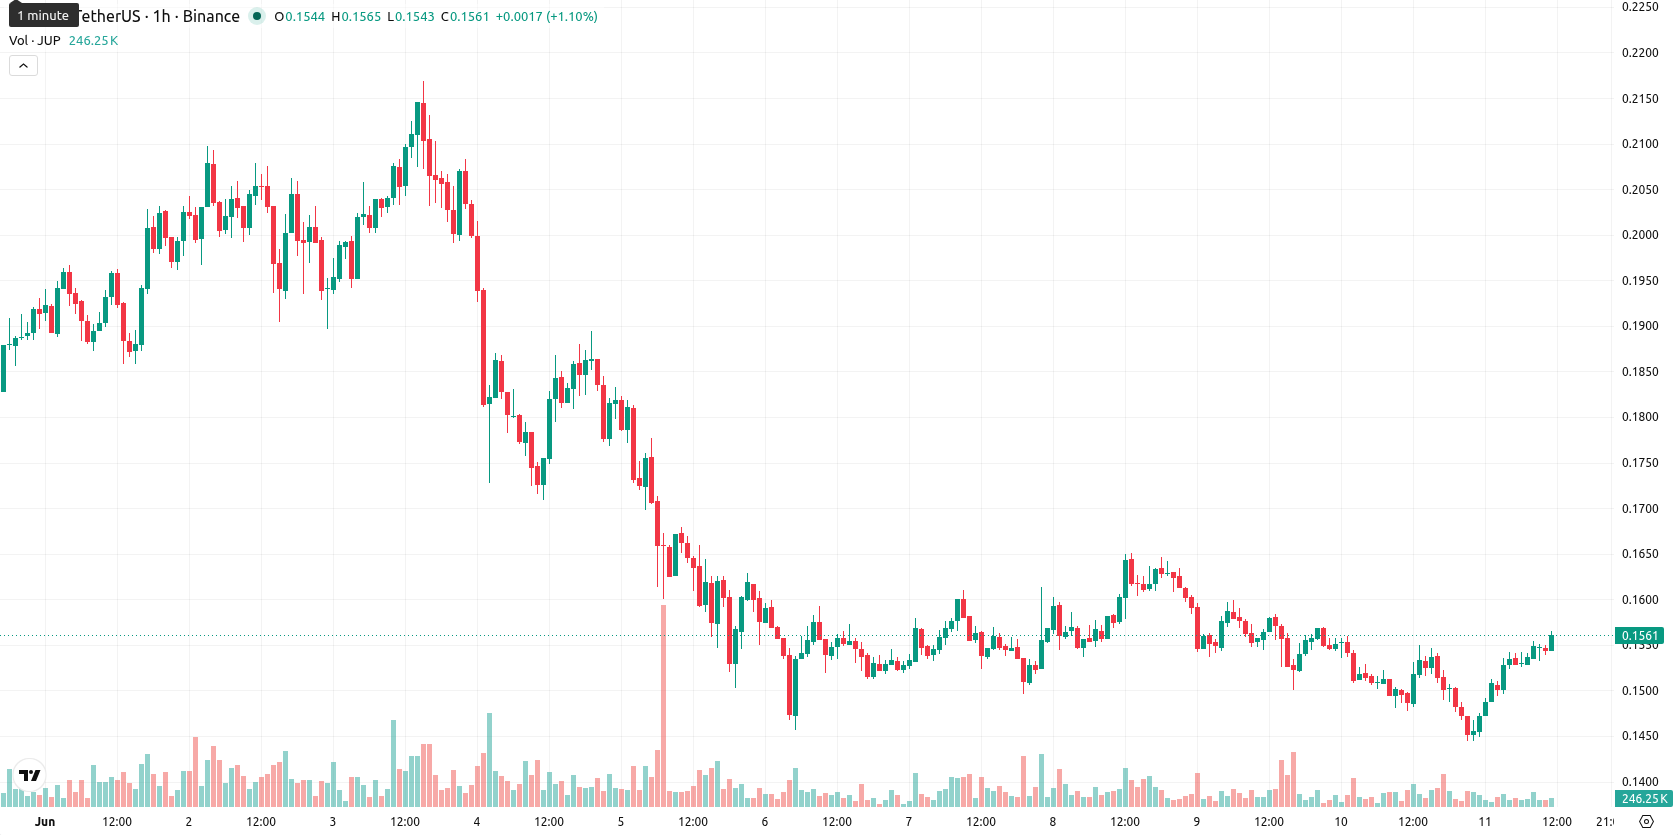
Jupiter (JUP) is trading at $0.1550 after a 4.17% gain today, closing near the day's high. The token stands above its key moving averages on short and medium timeframes, while long-term averages remain out of reach.
Highlights
- JUP/USD maintains a short- and medium-term bullish bias, trading decisively above short-term support levels.
- Momentum indicators broadly support further gains, but an overbought reading signals the rally may be stretched short term.
- Expected trading range for the next sessions is $0.1333–$0.1635, with a 65% probability of an upside continuation versus 35% downside risk.
Oscillator signals diverge as price rejects 200-day cap
The latest technical analysis sets MA-20 at $0.1509, MA-50 at $0.1524, and MA-200 at $0.1879. Price remains above the 20-day and 50-day moving averages, but below the 200-day. The Ichimoku Kijun level at $0.1499 serves as immediate support. Oscillators highlight mixed momentum: MACD issues a Buy, ADX signals Neutral, RSI stands at 58.1 (Buy), and CCI confirms Buy. Stoch RSI in the Overbought zone points to stretched conditions, while BBP shows buyers dominating the trading session. The Awesome Oscillator also aligns with upward bias.
Bullish bias dominates as breakouts hinge on consolidation
Over the next two to three sessions, the short-term forecast projects a trading range of $0.1333 to $0.1635. The probability of an upward extension stands at 65%, with further downside less likely at 35%. If price consolidates, JUP/USD may oscillate within this corridor. A decisive move above resistance could target the upper band, while a bearish break below support would expose the range lows.
Earlier, analysts noted that Jupiter had shifted into a bullish technical posture, with momentum and volatility favoring buyer dominance. The current analysis builds on that outlook, highlighting ongoing mixed signals but a prevailing upward bias, with renewed attention warranted on the potential for a breakout above intermediate resistance in the near term.


Latest Jupiter News


-
 Afghanistan
-
 Albania
-
 Algeria
-
 Angola
-
 Argentina
-
 Armenia
-
 Australia
-
 Austria
-
 Azerbaijan
-
 Bahamas
-
 Bahrain
-
 Bangladesh
-
 Belarus
-
 Belgium
-
 Bolivia
-
 Botswana
-
 Brazil
-
 Brunei
-
 Bulgaria
-
 Cambodia
-
 Cameroon
-
 Canada
-
 Chile
Chile
-
 China
China
-
 Colombia
-
 Congo
Congo
-
 Costa Rica
-
 Cote d'Ivoire
-
 Croatia
-
 Cuba
Cuba
-
 Cyprus
-
 Czechia
-
 DR Congo
-
 Denmark
-
 Dominican Republic
-
 Ecuador
-
 Egypt
Egypt
-
 El Salvador
-
 Estonia
-
 Eswatini
-
 Ethiopia
-
 Finland
-
 France
-
 Georgia
-
 Germany
-
 Ghana
Ghana
-
 Greece
-
 Haiti
Haiti
-
 Hong Kong
-
 Hungary
-
 India
India
-
 Indonesia
-
 Iran, Islamic republic
-
 Iraq
Iraq
-
 Ireland
-
 Israel
-
 Italy
Italy
-
 Jamaica
-
 Japan
Japan
-
 Jordan
-
 Kazakhstan
-
 Kenya
Kenya
-
 Korea
Korea
-
 Kuwait
-
 Kyrgyzstan
-
 Laos
Laos
-
 Latvia
-
 Lebanon
-
 Lesotho
-
 Libya
Libya
-
 Lithuania
-
 Luxembourg
-
 Madagascar
-
 Malaysia
-
 Malta
Malta
-
 Mauritius
-
 Mexico
-
 Moldova
-
 Mongolia
-
 Montenegro
-
 Morocco
-
 Mozambique
-
 Myanmar
-
 Namibia
-
 Nepal
Nepal
-
 Netherlands
-
 New Zealand
-
 Nigeria
-
 North Macedonia
-
 Norway
-
 Oman
Oman
-
 Pakistan
-
 Palestine
-
 Panama
-
 Papua New Guinea
-
 Paraguay
-
 Peru
Peru
-
 Philippines
-
 Poland
-
 Portugal
-
 Puerto Rico
-
 Qatar
Qatar
-
 Reunion
-
 Romania
-
 Rwanda
-
 Saudi Arabia
-
 Serbia
-
 Singapore
-
 Slovakia
-
 Slovenia
-
 Somalia
-
 South Africa
-
 Spain
Spain
-
 Sri Lanka
-
 Sweden
-
 Switzerland
-
 Syria
Syria
-
 Taiwan
-
 Tajikistan
-
 Tanzania
-
 Thailand
-
 Trinidad and Tobago
-
 Tunisia
-
 Turkey
-
 UAE
UAE
-
 Uganda
-
 Ukraine
-
 United Kingdom
-
United States
-
 Uruguay
-
 Uzbekistan
-
 Venezuela
-
 Vietnam
-
 Yemen
Yemen
-
 Zambia
-
 Zimbabwe
- Forex
- Crypto
