
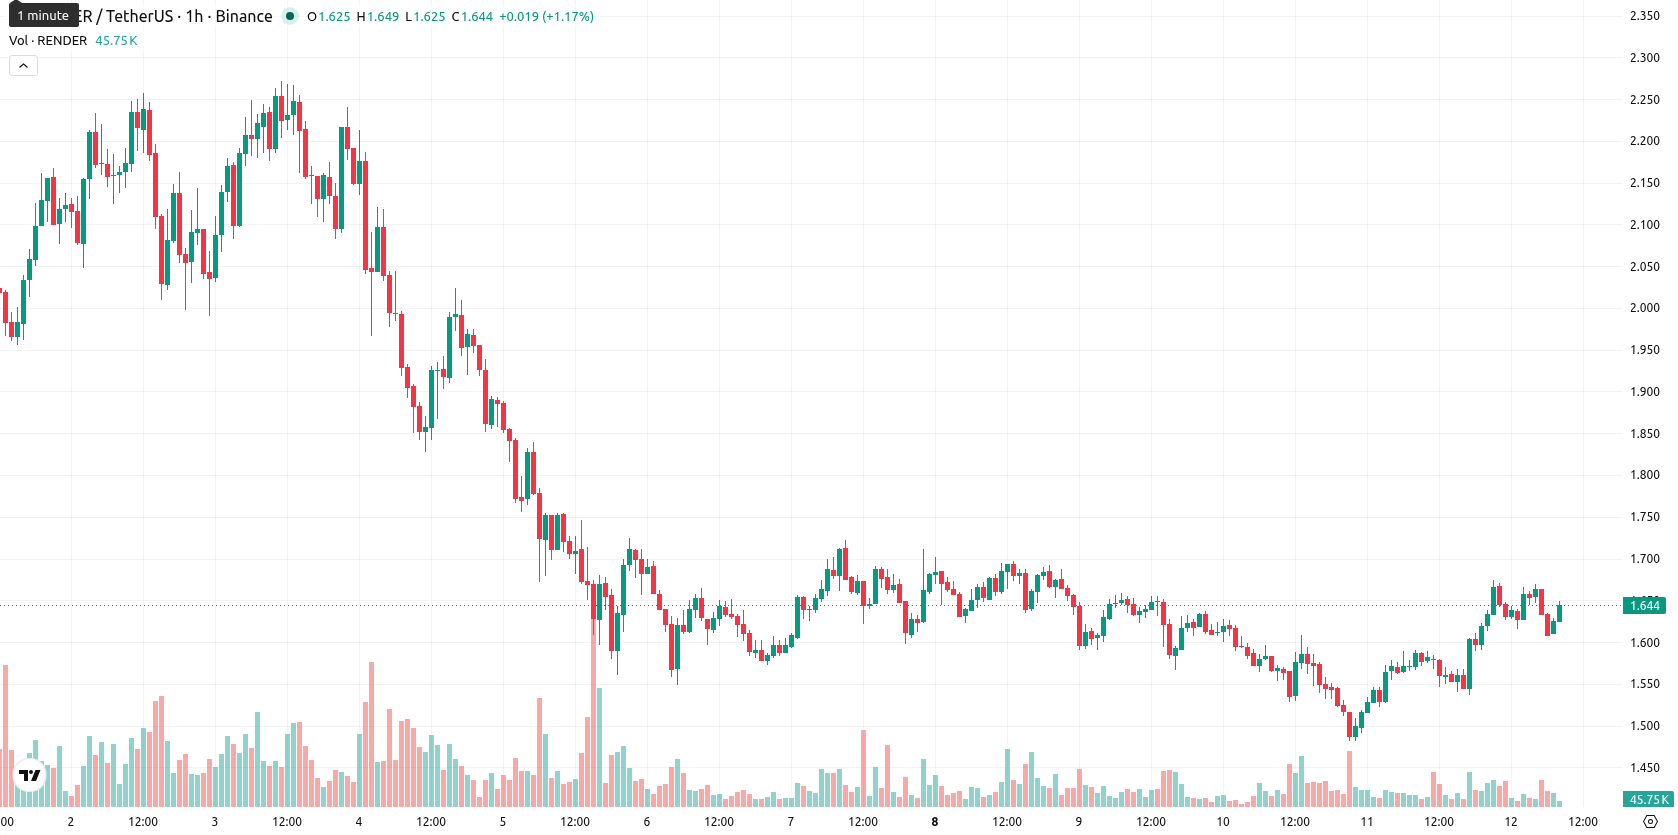
+4.51% for Render as buyers push price ahead of $1.7292 resistance

Render (RENDER) is trading at $1.647, up 4.51% on the day. The asset is positioned above its key short- and medium-term moving averages, while still remaining below longer-term trend indicators.
Highlights
- Short- and medium-term momentum is bullish, but price trades below its long-term trend, confirming a broader downtrend.
- Major indicators show a split outlook: momentum and oscillators are bullish while trend and volume strength remain inconclusive.
- Price is expected to range sideways between $1.4320 and $1.7009 over the next 2–3 days, with a 57% probability of an upward move.
Mixed momentum signals as technical boundaries tighten
The MA-20 ($1.6141) is above the MA-50 ($1.5787), both below the MA-200 ($1.7292), placing intermediate resistance at $1.7292. The Ichimoku Kijun level ($1.6050) acts as immediate support for the current move. MACD currently signals strong buy momentum, whereas the ADX is neutral, indicating indecisive trend strength. Oscillators remain contradictory, with RSI delivering a buy signal, the Stoch RSI pointing toward oversold conditions, and CCI neutral. Bull/Bear Power (BBP) shows a seller bias, while the Awesome Oscillator is neutral, reflecting fragmented conviction across indicators.
Sideways bias dominates as volatility bands define outlook
In the next two or three trading days, price is expected to move within $1.4320 and $1.7009, representing a typical volatility band relative to current levels. Probability estimates favor an upward move at 57%, while a 43% likelihood is assigned to further declines. The baseline expectation is for the price to remain in a sideways range; a break above resistance could accelerate further gains, while failure of immediate support would increase downside risk.
Previously it was reported that Render was facing persistent seller control across all key timeframes, with technical signals highlighting indecision and vulnerability to further downside. The latest data suggests a more balanced, rangebound setup with increased probabilities for a bullish move, making a sustained break above the long-term moving average a pivotal indicator for near-term momentum.


-
 Afghanistan
-
 Albania
-
 Algeria
-
 Angola
-
 Argentina
-
 Armenia
-
 Australia
-
 Austria
-
 Azerbaijan
-
 Bahamas
-
 Bahrain
-
 Bangladesh
-
 Belarus
-
 Belgium
-
 Bolivia
-
 Botswana
-
 Brazil
-
 Brunei
-
 Bulgaria
-
 Cambodia
-
 Cameroon
-
 Canada
-
 Chile
Chile
-
 China
China
-
 Colombia
-
 Congo
Congo
-
 Costa Rica
-
 Cote d'Ivoire
-
 Croatia
-
 Cuba
Cuba
-
 Cyprus
-
 Czechia
-
 DR Congo
-
 Denmark
-
 Dominican Republic
-
 Ecuador
-
 Egypt
Egypt
-
 El Salvador
-
 Estonia
-
 Eswatini
-
 Ethiopia
-
 Finland
-
 France
-
 Georgia
-
 Germany
-
 Ghana
Ghana
-
 Greece
-
 Haiti
Haiti
-
 Hong Kong
-
 Hungary
-
 India
India
-
 Indonesia
-
 Iran, Islamic republic
-
 Iraq
Iraq
-
 Ireland
-
 Israel
-
 Italy
Italy
-
 Jamaica
-
 Japan
Japan
-
 Jordan
-
 Kazakhstan
-
 Kenya
Kenya
-
 Korea
Korea
-
 Kuwait
-
 Kyrgyzstan
-
 Laos
Laos
-
 Latvia
-
 Lebanon
-
 Lesotho
-
 Libya
Libya
-
 Lithuania
-
 Luxembourg
-
 Madagascar
-
 Malaysia
-
 Malta
Malta
-
 Mauritius
-
 Mexico
-
 Moldova
-
 Mongolia
-
 Montenegro
-
 Morocco
-
 Mozambique
-
 Myanmar
-
 Namibia
-
 Nepal
Nepal
-
 Netherlands
-
 New Zealand
-
 Nigeria
-
 North Macedonia
-
 Norway
-
 Oman
Oman
-
 Pakistan
-
 Palestine
-
 Panama
-
 Papua New Guinea
-
 Paraguay
-
 Peru
Peru
-
 Philippines
-
 Poland
-
 Portugal
-
 Puerto Rico
-
 Qatar
Qatar
-
 Reunion
-
 Romania
-
 Rwanda
-
 Saudi Arabia
-
 Serbia
-
 Singapore
-
 Slovakia
-
 Slovenia
-
 Somalia
-
 South Africa
-
 Spain
Spain
-
 Sri Lanka
-
 Sweden
-
 Switzerland
-
 Syria
Syria
-
 Taiwan
-
 Tajikistan
-
 Tanzania
-
 Thailand
-
 Trinidad and Tobago
-
 Tunisia
-
 Turkey
-
 UAE
UAE
-
 Uganda
-
 Ukraine
-
 United Kingdom
-
United States
-
 Uruguay
-
 Uzbekistan
-
 Venezuela
-
 Vietnam
-
 Yemen
Yemen
-
 Zambia
-
 Zimbabwe
- Forex
- Crypto
