
Walrus declines as trading stays depressed well under long-term price averages

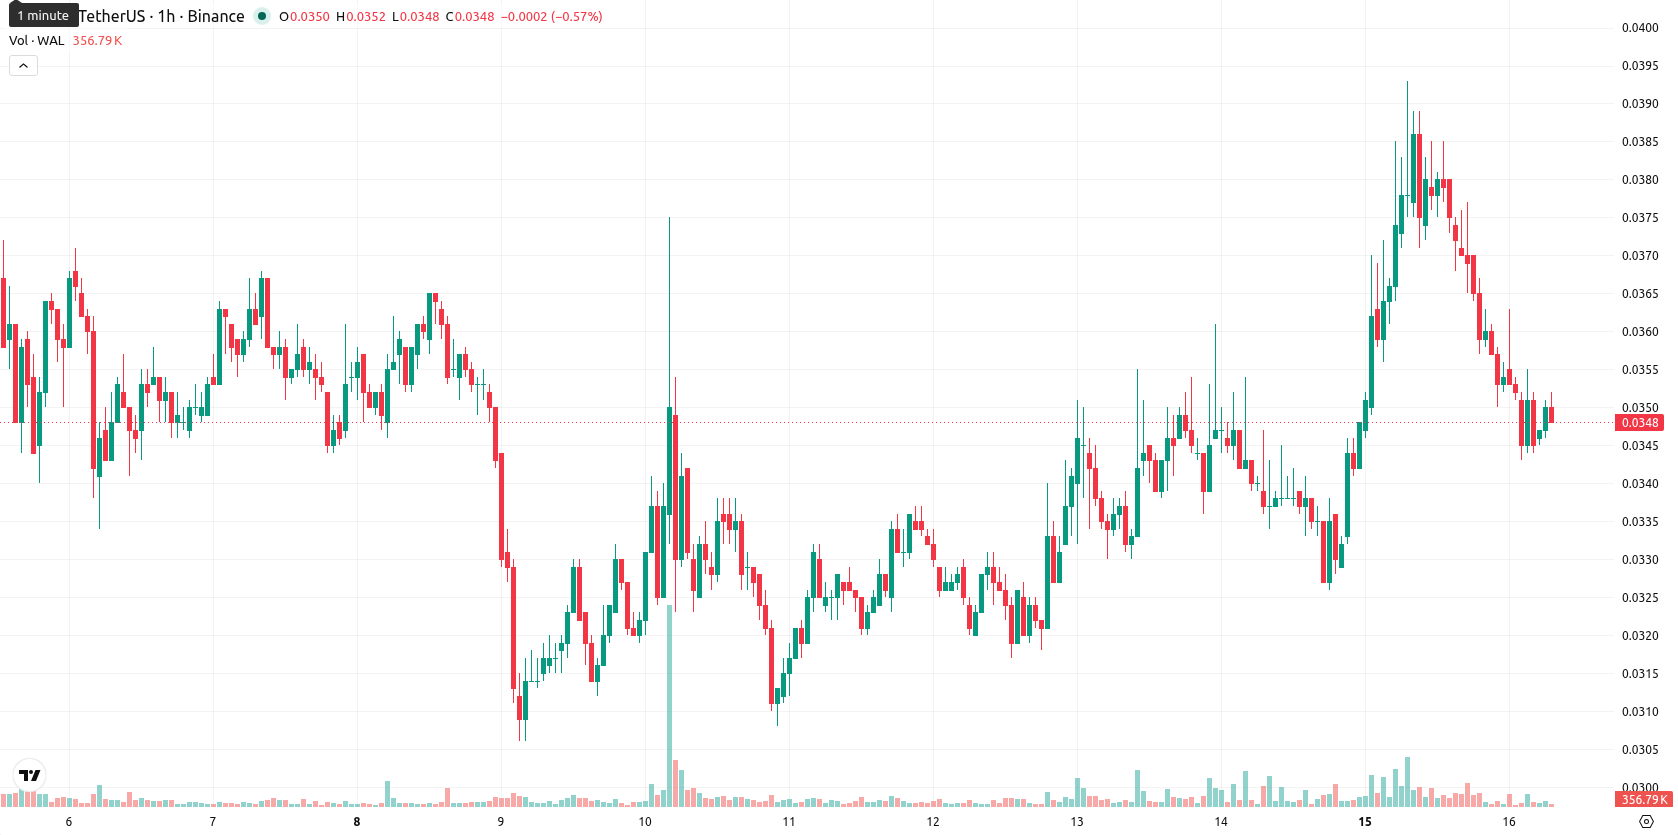
Walrus (WAL) is trading at $0.0351, posting a daily decline of 7.37%. The price is positioned below its key moving averages, underscoring prevailing short-term and long-term weakness.
Highlights
- WAL/USD trades below key moving averages, reflecting entrenched bearish momentum across all timeframes.
- Technical oscillators show a divergence, with some signaling potential for a short-term bounce from oversold conditions.
- WAL/USD is likely to consolidate between $0.0332 and $0.0377 over the next 2–3 days, with a 64% probability of further downside.
Mixed sell signals as oscillators diverge near key resistance
On the H1 chart, WAL/USD is trading below the MA-20 ($0.0362) and MA-50 ($0.0354) as well as the daily MA-200 ($0.0930). Immediate resistance is marked at the Ichimoku Kijun level of $0.0368. MACD indicates ongoing sell momentum, but the ADX remains on a buy signal, suggesting some seller dominance may be losing steam. RSI sits at 38.6, pointing to a sell bias, while the Stoch RSI is in a strong buy zone and the CCI is oversold, revealing a mixed technical picture with divergence among oscillators. The Bull/Bear Power (BBP) and Awesome Oscillator both support further downside pressure, and price is mid-range with high volatility at present.
Further declines likely as consolidation holds within volatile range
In the near term, WAL/USD is expected to consolidate within the $0.0332 to $0.0377 range, a typical volatility band relative to current levels. Probabilities favor a downward bias, with a 64% likelihood of a further decline and only a 36% chance of an upward move. The baseline scenario is for range-bound trading, with upside scenarios only materializing if price decisively breaks above $0.0368 resistance, while a move below $0.0332 would trigger additional downside risk.
Earlier, analysts noted that Walrus faced persistent downward pressure despite brief rebounds, highlighting potential downside risks amid mixed technical signals. With continued volatility and deepening divergence among momentum indicators, traders should monitor for a decisive move below $0.0332, which would signal renewed bearish momentum.


Latest Walrus News


-
 Afghanistan
-
 Albania
-
 Algeria
-
 Angola
-
 Argentina
-
 Armenia
-
 Australia
-
 Austria
-
 Azerbaijan
-
 Bahamas
-
 Bahrain
-
 Bangladesh
-
 Belarus
-
 Belgium
-
 Bolivia
-
 Botswana
-
 Brazil
-
 Brunei
-
 Bulgaria
-
 Cambodia
-
 Cameroon
-
 Canada
-
 Chile
Chile
-
 China
China
-
 Colombia
-
 Congo
Congo
-
 Costa Rica
-
 Cote d'Ivoire
-
 Croatia
-
 Cuba
Cuba
-
 Cyprus
-
 Czechia
-
 DR Congo
-
 Denmark
-
 Dominican Republic
-
 Ecuador
-
 Egypt
Egypt
-
 El Salvador
-
 Estonia
-
 Eswatini
-
 Ethiopia
-
 Finland
-
 France
-
 Georgia
-
 Germany
-
 Ghana
Ghana
-
 Greece
-
 Haiti
Haiti
-
 Hong Kong
-
 Hungary
-
 India
India
-
 Indonesia
-
 Iran, Islamic republic
-
 Iraq
Iraq
-
 Ireland
-
 Israel
-
 Italy
Italy
-
 Jamaica
-
 Japan
Japan
-
 Jordan
-
 Kazakhstan
-
 Kenya
Kenya
-
 Korea
Korea
-
 Kuwait
-
 Kyrgyzstan
-
 Laos
Laos
-
 Latvia
-
 Lebanon
-
 Lesotho
-
 Libya
Libya
-
 Lithuania
-
 Luxembourg
-
 Madagascar
-
 Malaysia
-
 Malta
Malta
-
 Mauritius
-
 Mexico
-
 Moldova
-
 Mongolia
-
 Montenegro
-
 Morocco
-
 Mozambique
-
 Myanmar
-
 Namibia
-
 Nepal
Nepal
-
 Netherlands
-
 New Zealand
-
 Nigeria
-
 North Macedonia
-
 Norway
-
 Oman
Oman
-
 Pakistan
-
 Palestine
-
 Panama
-
 Papua New Guinea
-
 Paraguay
-
 Peru
Peru
-
 Philippines
-
 Poland
-
 Portugal
-
 Puerto Rico
-
 Qatar
Qatar
-
 Reunion
-
 Romania
-
 Rwanda
-
 Saudi Arabia
-
 Serbia
-
 Singapore
-
 Slovakia
-
 Slovenia
-
 Somalia
-
 South Africa
-
 Spain
Spain
-
 Sri Lanka
-
 Sweden
-
 Switzerland
-
 Syria
Syria
-
 Taiwan
-
 Tajikistan
-
 Tanzania
-
 Thailand
-
 Trinidad and Tobago
-
 Tunisia
-
 Turkey
-
 UAE
UAE
-
 Uganda
-
 Ukraine
-
 United Kingdom
-
United States
-
 Uruguay
-
 Uzbekistan
-
 Venezuela
-
 Vietnam
-
 Yemen
Yemen
-
 Zambia
-
 Zimbabwe
- Forex
- Crypto
