
Bitcoin price prediction: Will $64,543.60–$67,129.02 range hold? BTC trades flat

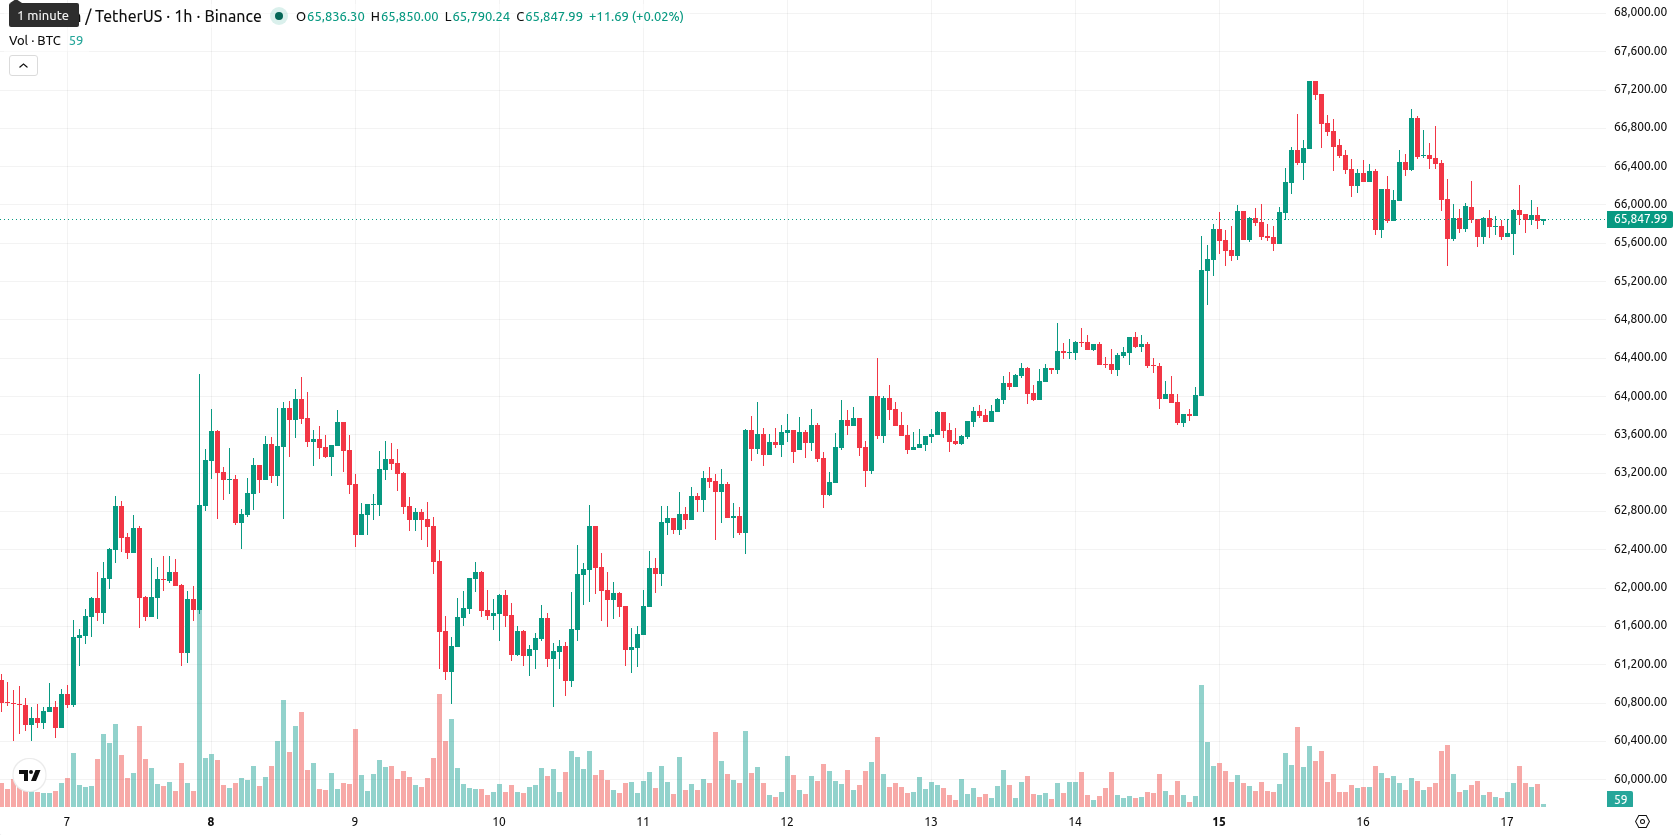
Bitcoin (BTC) is trading at $65,836.31 after slipping 0.32% over the last 24 hours. The asset currently sits below its key moving averages, reflecting a short-term decline amid moderate daily volatility.
Highlights
- BlackRock introduced BITA, an income-focused Bitcoin ETF using covered calls, expanding income opportunities for institutional and retail investors.
- Grayscale's $124 million transfer of 1,863 BTC to Coinbase Prime was routine ETF activity, with no market disruption.
- BTC/USD faces seller pressure below key moving averages, with an expected range of $64,543.60–$67,129.02 and near-term indecision at resistance.
ETF launches and routine redemptions as regulatory clarity boosts sentiment
BlackRock’s launch of BITA, an income-oriented ETF for Bitcoin using a covered call strategy, marked the introduction of a new income-generating avenue and broadened product scope for both institutional and retail investors, according to Thedailyupside. In parallel, Grayscale moved 1,863 BTC, valued at approximately $124 million, to Coinbase Prime as part of standard ETF redemption activity, a transfer described by Cryptonews as routine and without signs of market disruption. Regulatory clarity was further advanced as the SEC's March 17, 2026 interpretive release confirmed Bitcoin’s status as a digital commodity under CFTC oversight, resolving prior uncertainties around its classification; though price action has remained under broader selling pressure.
Bearish bias and indicator divergence as resistance limits upside
BTC remains below the MA-20 ($65,958.54) and MA-50 ($66,146.22) on the H1 chart, with the MA-200 ($77,431.92, daily) setting a high long-term ceiling. The Ichimoku Kijun at $66,176.46 is acting as immediate resistance. MACD signals strong bearish momentum, while the ADX reflects a neutral trend environment. RSI is at 49.71 and leans negative, with the CCI offering little directional bias. Stoch RSI and BBP both register overbought levels, suggesting short-term buyers may be reaching exhaustion. The Awesome Oscillator remains neutral, highlighting a divergence among the indicators and elevated intraday indecision near resistance.
Moderate upside edge as sideways action remains likely
Looking ahead over the next 2–3 trading days, BTC is expected to fluctuate within a typical volatility band between $64,543.60 and $67,129.02. Current probabilities suggest a 60% chance of an upside move, making gains somewhat more likely, although a retest of lower support is possible. The base scenario calls for sideways trading within this corridor. A decisive break above immediate resistance would trigger a bullish extension, while a drop below the lower band may result in further declines.
Earlier, analysts noted that new Bitcoin financial products are being developed by building income and stability layers on top of the core BTC network, rather than altering its protocol. Recent developments such as the launch of income-focused ETFs and regulatory clarification further expand this ecosystem, and traders should now watch for a break above $67,129.02 or below $64,543.60 to signal the next significant shift in momentum.


-
 Afghanistan
-
 Albania
-
 Algeria
-
 Angola
-
 Argentina
-
 Armenia
-
 Australia
-
 Austria
-
 Azerbaijan
-
 Bahamas
-
 Bahrain
-
 Bangladesh
-
 Belarus
-
 Belgium
-
 Bolivia
-
 Botswana
-
 Brazil
-
 Brunei
-
 Bulgaria
-
 Cambodia
-
 Cameroon
-
 Canada
-
 Chile
Chile
-
 China
China
-
 Colombia
-
 Congo
Congo
-
 Costa Rica
-
 Cote d'Ivoire
-
 Croatia
-
 Cuba
Cuba
-
 Cyprus
-
 Czechia
-
 DR Congo
-
 Denmark
-
 Dominican Republic
-
 Ecuador
-
 Egypt
Egypt
-
 El Salvador
-
 Estonia
-
 Eswatini
-
 Ethiopia
-
 Finland
-
 France
-
 Georgia
-
 Germany
-
 Ghana
Ghana
-
 Greece
-
 Haiti
Haiti
-
 Hong Kong
-
 Hungary
-
 India
India
-
 Indonesia
-
 Iran, Islamic republic
-
 Iraq
Iraq
-
 Ireland
-
 Israel
-
 Italy
Italy
-
 Jamaica
-
 Japan
Japan
-
 Jordan
-
 Kazakhstan
-
 Kenya
Kenya
-
 Korea
Korea
-
 Kuwait
-
 Kyrgyzstan
-
 Laos
Laos
-
 Latvia
-
 Lebanon
-
 Lesotho
-
 Libya
Libya
-
 Lithuania
-
 Luxembourg
-
 Madagascar
-
 Malaysia
-
 Malta
Malta
-
 Mauritius
-
 Mexico
-
 Moldova
-
 Mongolia
-
 Montenegro
-
 Morocco
-
 Mozambique
-
 Myanmar
-
 Namibia
-
 Nepal
Nepal
-
 Netherlands
-
 New Zealand
-
 Nigeria
-
 North Macedonia
-
 Norway
-
 Oman
Oman
-
 Pakistan
-
 Palestine
-
 Panama
-
 Papua New Guinea
-
 Paraguay
-
 Peru
Peru
-
 Philippines
-
 Poland
-
 Portugal
-
 Puerto Rico
-
 Qatar
Qatar
-
 Reunion
-
 Romania
-
 Rwanda
-
 Saudi Arabia
-
 Serbia
-
 Singapore
-
 Slovakia
-
 Slovenia
-
 Somalia
-
 South Africa
-
 Spain
Spain
-
 Sri Lanka
-
 Sweden
-
 Switzerland
-
 Syria
Syria
-
 Taiwan
-
 Tajikistan
-
 Tanzania
-
 Thailand
-
 Trinidad and Tobago
-
 Tunisia
-
 Turkey
-
 UAE
UAE
-
 Uganda
-
 Ukraine
-
 United Kingdom
-
United States
-
 Uruguay
-
 Uzbekistan
-
 Venezuela
-
 Vietnam
-
 Yemen
Yemen
-
 Zambia
-
 Zimbabwe
- Forex
- Crypto
