
-9.73% for Jito as price stays below major moving averages

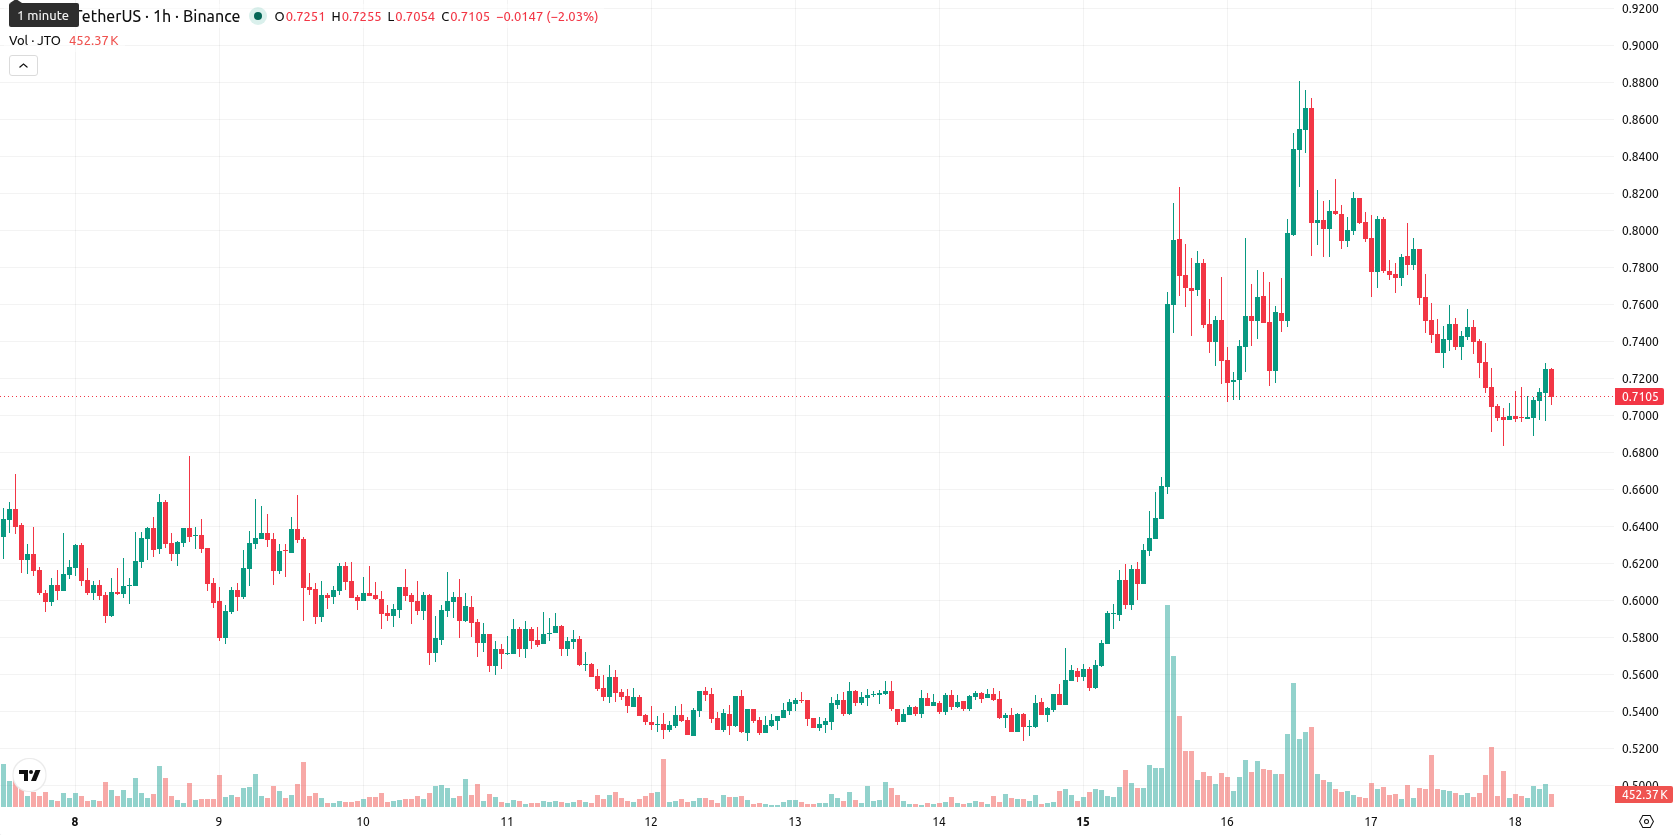
Jito (JTO) is trading at $0.7089, down 9.73% on the day. The price currently sits below its key moving averages, indicating ongoing near-term pressure compared to medium-term trends.
Highlights
- JTO/USD faces sustained bearish momentum, trading below key short- and medium-term moving averages while long-term bullish structure remains intact.
- Momentum and trend indicators reflect broad selling pressure, yet intraday signals like BBP diverge, marking mixed and volatile short-term sentiment.
- Anticipate consolidation between $0.6291 and $0.7887 over the next 2–3 days, with a 65% probability of upward moves if resistance at $0.7437 breaks.
Downtrend momentum persists as resistance levels cap rebounds
JTO is trading below the MA-20 at $0.7209 and the MA-50 at $0.7622, with both levels acting as immediate technical resistance and reflecting ongoing seller dominance in the near- and medium-term. The MA-200 at $0.3809 remains intact as a longer-term support, while the Ichimoku Kijun at $0.7437 serves as a key resistance threshold in this setup. On the momentum front, MACD signals Strong Sell and ADX indicates sell, confirming sustained downward momentum. The RSI is at 44.828, in sell territory, while Stoch RSI is Overbought, adding potential for a countertrend move. CCI stands at Neutral, and BBP shows Strong Buy, highlighting intraday buyer activity that diverges from the prevailing trend. Volatility remains elevated, with JTO trading mid-range amid unstable price action.
Upside favored as JTO consolidates within volatility band
Over the next 2–3 trading days, JTO is expected to consolidate within the typical volatility band of $0.6291 to $0.7887. The probability of an upward move is 65%, with a less likely 35% chance of a further decline. A bullish scenario would see JTO breaking above resistance at $0.7437, potentially triggering renewed buying. Conversely, a drop below the $0.6291 support level may open the way for additional losses in the short term.
Earlier, analysts noted that Jito was exhibiting bullish momentum supported by increased trading activity and positive structural signals. The recent shift to sustained downside pressure and a sub-average technical posture highlights the importance of monitoring breakout potential above resistance at $0.7437 or breakdown risks below $0.6291 for short-term positioning.


Latest Jito News


-
 Afghanistan
-
 Albania
-
 Algeria
-
 Angola
-
 Argentina
-
 Armenia
-
 Australia
-
 Austria
-
 Azerbaijan
-
 Bahamas
-
 Bahrain
-
 Bangladesh
-
 Belarus
-
 Belgium
-
 Bolivia
-
 Botswana
-
 Brazil
-
 Brunei
-
 Bulgaria
-
 Cambodia
-
 Cameroon
-
 Canada
-
 Chile
Chile
-
 China
China
-
 Colombia
-
 Congo
Congo
-
 Costa Rica
-
 Cote d'Ivoire
-
 Croatia
-
 Cuba
Cuba
-
 Cyprus
-
 Czechia
-
 DR Congo
-
 Denmark
-
 Dominican Republic
-
 Ecuador
-
 Egypt
Egypt
-
 El Salvador
-
 Estonia
-
 Eswatini
-
 Ethiopia
-
 Finland
-
 France
-
 Georgia
-
 Germany
-
 Ghana
Ghana
-
 Greece
-
 Haiti
Haiti
-
 Hong Kong
-
 Hungary
-
 India
India
-
 Indonesia
-
 Iran, Islamic republic
-
 Iraq
Iraq
-
 Ireland
-
 Israel
-
 Italy
Italy
-
 Jamaica
-
 Japan
Japan
-
 Jordan
-
 Kazakhstan
-
 Kenya
Kenya
-
 Korea
Korea
-
 Kuwait
-
 Kyrgyzstan
-
 Laos
Laos
-
 Latvia
-
 Lebanon
-
 Lesotho
-
 Libya
Libya
-
 Lithuania
-
 Luxembourg
-
 Madagascar
-
 Malaysia
-
 Malta
Malta
-
 Mauritius
-
 Mexico
-
 Moldova
-
 Mongolia
-
 Montenegro
-
 Morocco
-
 Mozambique
-
 Myanmar
-
 Namibia
-
 Nepal
Nepal
-
 Netherlands
-
 New Zealand
-
 Nigeria
-
 North Macedonia
-
 Norway
-
 Oman
Oman
-
 Pakistan
-
 Palestine
-
 Panama
-
 Papua New Guinea
-
 Paraguay
-
 Peru
Peru
-
 Philippines
-
 Poland
-
 Portugal
-
 Puerto Rico
-
 Qatar
Qatar
-
 Reunion
-
 Romania
-
 Rwanda
-
 Saudi Arabia
-
 Serbia
-
 Singapore
-
 Slovakia
-
 Slovenia
-
 Somalia
-
 South Africa
-
 Spain
Spain
-
 Sri Lanka
-
 Sweden
-
 Switzerland
-
 Syria
Syria
-
 Taiwan
-
 Tajikistan
-
 Tanzania
-
 Thailand
-
 Trinidad and Tobago
-
 Tunisia
-
 Turkey
-
 UAE
UAE
-
 Uganda
-
 Ukraine
-
 United Kingdom
-
United States
-
 Uruguay
-
 Uzbekistan
-
 Venezuela
-
 Vietnam
-
 Yemen
Yemen
-
 Zambia
-
 Zimbabwe
- Forex
- Crypto
