
Stellar price prediction: Can $0.1988 support hold as XLM falls 8.78%?

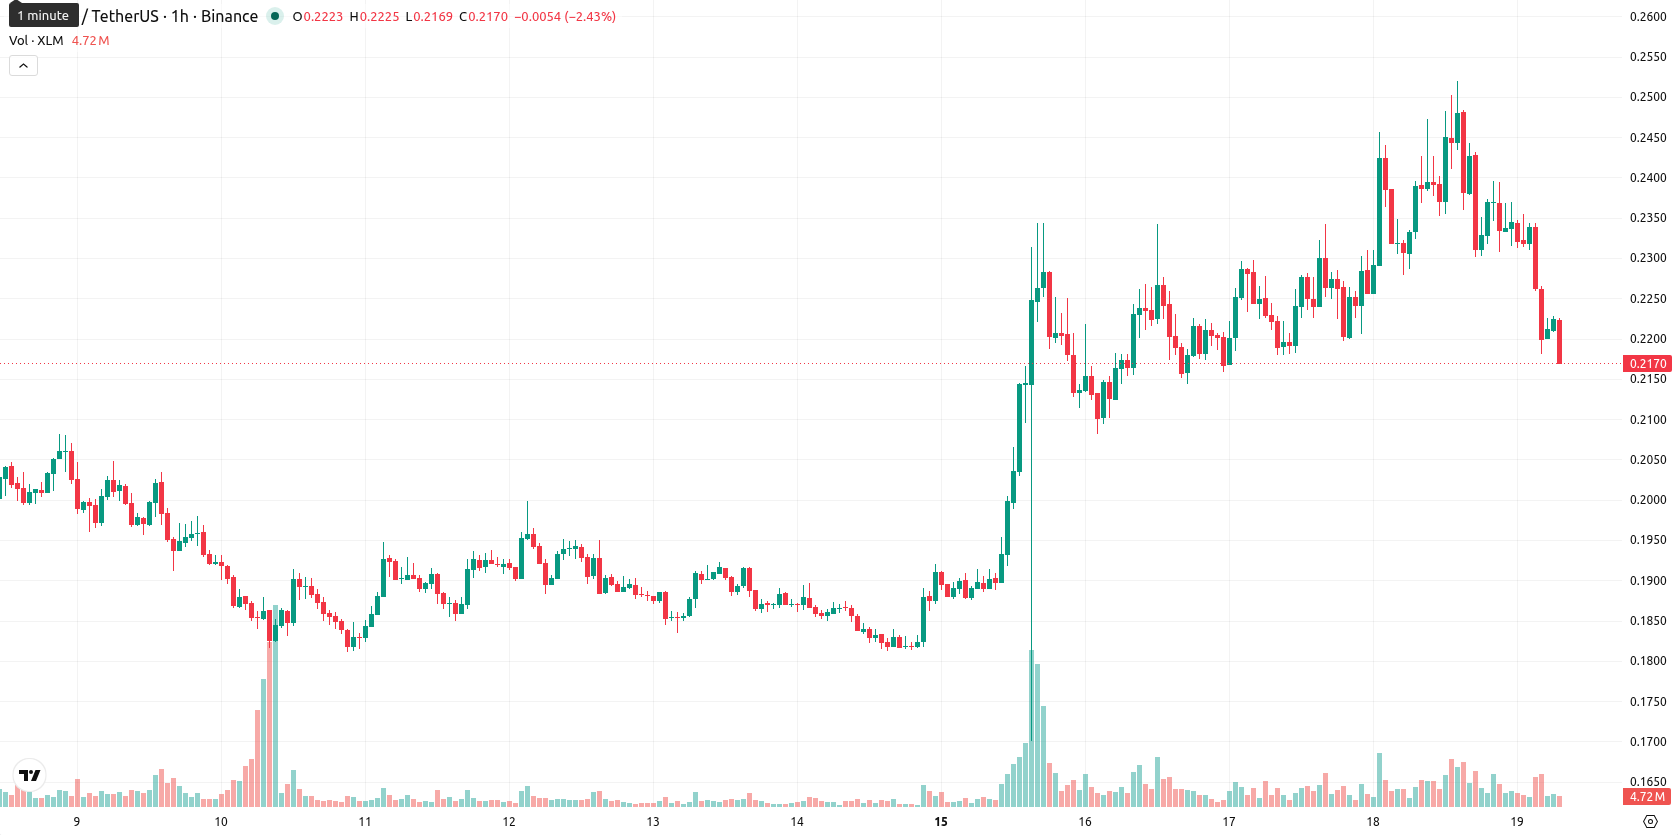
Stellar (XLM) is trading at $0.2171, down 8.78% on the day and sitting near the session low. The asset is now below its key moving averages, reflecting pronounced intraday weakness.
Highlights
- DTCC selected Stellar for tokenizing U.S. equities, ETFs, and Treasuries, confirming institutional integration and a July 2026 testnet launch.
- MoneyGram deepened its blockchain partnership with Stellar, coinciding with a reported $1.32 million XLM derivatives short squeeze and heightened volatility.
- XLM trades below short- and medium-term moving averages, with bearish momentum dominating and an expected trading range of $0.1988 to $0.2354 in the near term.
Institutional partnerships and short squeeze propel volatility amid selloff
Stellar was officially selected by DTCC for the tokenization of U.S. equities, ETFs, and Treasuries, a development confirmed by En Spaziocrypto, highlighting the network's integration into institutional-grade capital markets infrastructure. The upcoming DTCC testnet for tokenized US securities, scheduled for July 2026, establishes a concrete timeline for broader blockchain adoption and future demand potential. Separately, MoneyGram has expanded its blockchain collaboration with Stellar ahead of an institutional finance event, according to Tronweekly, while Pluang reported a $1.32 million short squeeze in XLM derivatives that contributed to market volatility. These developments occurred as the price remained under broader selling pressure.
Negative momentum intensifies as key supports face pressure
On the technical front, XLM/USD has moved below both the MA-20 ($0.2341) and MA-50 ($0.2308) levels on the hourly chart, while remaining above the MA-200 ($0.1863). The MA-200 serves as long-term support, with the Ichimoku Kijun at $0.2351 identified as immediate resistance. Intraday momentum signals remain negative: MACD shows a sell signal; ADX suggests a neutral trend; RSI at 38.231 points to continued selling pressure. The Stoch RSI and CCI are both in oversold territory, confirming the depth of the recent move, while BBP indicates sellers are dominating short-term action and AO supports ongoing downside momentum.
Downside risk dominates as volatility drives wide trading range
Over the next two to three trading days, XLM is expected to consolidate within a relatively wide band between $0.1988 and $0.2354, reflecting typical volatility in the current environment. There is a 65% probability of further downside, with the baseline scenario favoring sideways price action. If the price breaks above $0.2351, a short-term rebound could occur, while a close below $0.1988 would indicate continued downside risk and an extension of the prevailing downtrend.
Earlier, analysts noted that Stellar's expanding ecosystem and institutional integration positioned the asset for further progress, despite a mixed technical outlook. The current environment, marked by pronounced price weakness amid significant fundamental developments, places added importance on the $0.1988 support as a critical level to monitor for downside risk in the days ahead.


-
 Afghanistan
-
 Albania
-
 Algeria
-
 Angola
-
 Argentina
-
 Armenia
-
 Australia
-
 Austria
-
 Azerbaijan
-
 Bahamas
-
 Bahrain
-
 Bangladesh
-
 Belarus
-
 Belgium
-
 Bolivia
-
 Botswana
-
 Brazil
-
 Brunei
-
 Bulgaria
-
 Cambodia
-
 Cameroon
-
 Canada
-
 Chile
Chile
-
 China
China
-
 Colombia
-
 Congo
Congo
-
 Costa Rica
-
 Cote d'Ivoire
-
 Croatia
-
 Cuba
Cuba
-
 Cyprus
-
 Czechia
-
 DR Congo
-
 Denmark
-
 Dominican Republic
-
 Ecuador
-
 Egypt
Egypt
-
 El Salvador
-
 Estonia
-
 Eswatini
-
 Ethiopia
-
 Finland
-
 France
-
 Georgia
-
 Germany
-
 Ghana
Ghana
-
 Greece
-
 Haiti
Haiti
-
 Hong Kong
-
 Hungary
-
 India
India
-
 Indonesia
-
 Iran, Islamic republic
-
 Iraq
Iraq
-
 Ireland
-
 Israel
-
 Italy
Italy
-
 Jamaica
-
 Japan
Japan
-
 Jordan
-
 Kazakhstan
-
 Kenya
Kenya
-
 Korea
Korea
-
 Kuwait
-
 Kyrgyzstan
-
 Laos
Laos
-
 Latvia
-
 Lebanon
-
 Lesotho
-
 Libya
Libya
-
 Lithuania
-
 Luxembourg
-
 Madagascar
-
 Malaysia
-
 Malta
Malta
-
 Mauritius
-
 Mexico
-
 Moldova
-
 Mongolia
-
 Montenegro
-
 Morocco
-
 Mozambique
-
 Myanmar
-
 Namibia
-
 Nepal
Nepal
-
 Netherlands
-
 New Zealand
-
 Nigeria
-
 North Macedonia
-
 Norway
-
 Oman
Oman
-
 Pakistan
-
 Palestine
-
 Panama
-
 Papua New Guinea
-
 Paraguay
-
 Peru
Peru
-
 Philippines
-
 Poland
-
 Portugal
-
 Puerto Rico
-
 Qatar
Qatar
-
 Reunion
-
 Romania
-
 Rwanda
-
 Saudi Arabia
-
 Serbia
-
 Singapore
-
 Slovakia
-
 Slovenia
-
 Somalia
-
 South Africa
-
 Spain
Spain
-
 Sri Lanka
-
 Sweden
-
 Switzerland
-
 Syria
Syria
-
 Taiwan
-
 Tajikistan
-
 Tanzania
-
 Thailand
-
 Trinidad and Tobago
-
 Tunisia
-
 Turkey
-
 UAE
UAE
-
 Uganda
-
 Ukraine
-
 United Kingdom
-
United States
-
 Uruguay
-
 Uzbekistan
-
 Venezuela
-
 Vietnam
-
 Yemen
Yemen
-
 Zambia
-
 Zimbabwe
- Forex
- Crypto
