
Pepe slides as price remains well below the long-term average

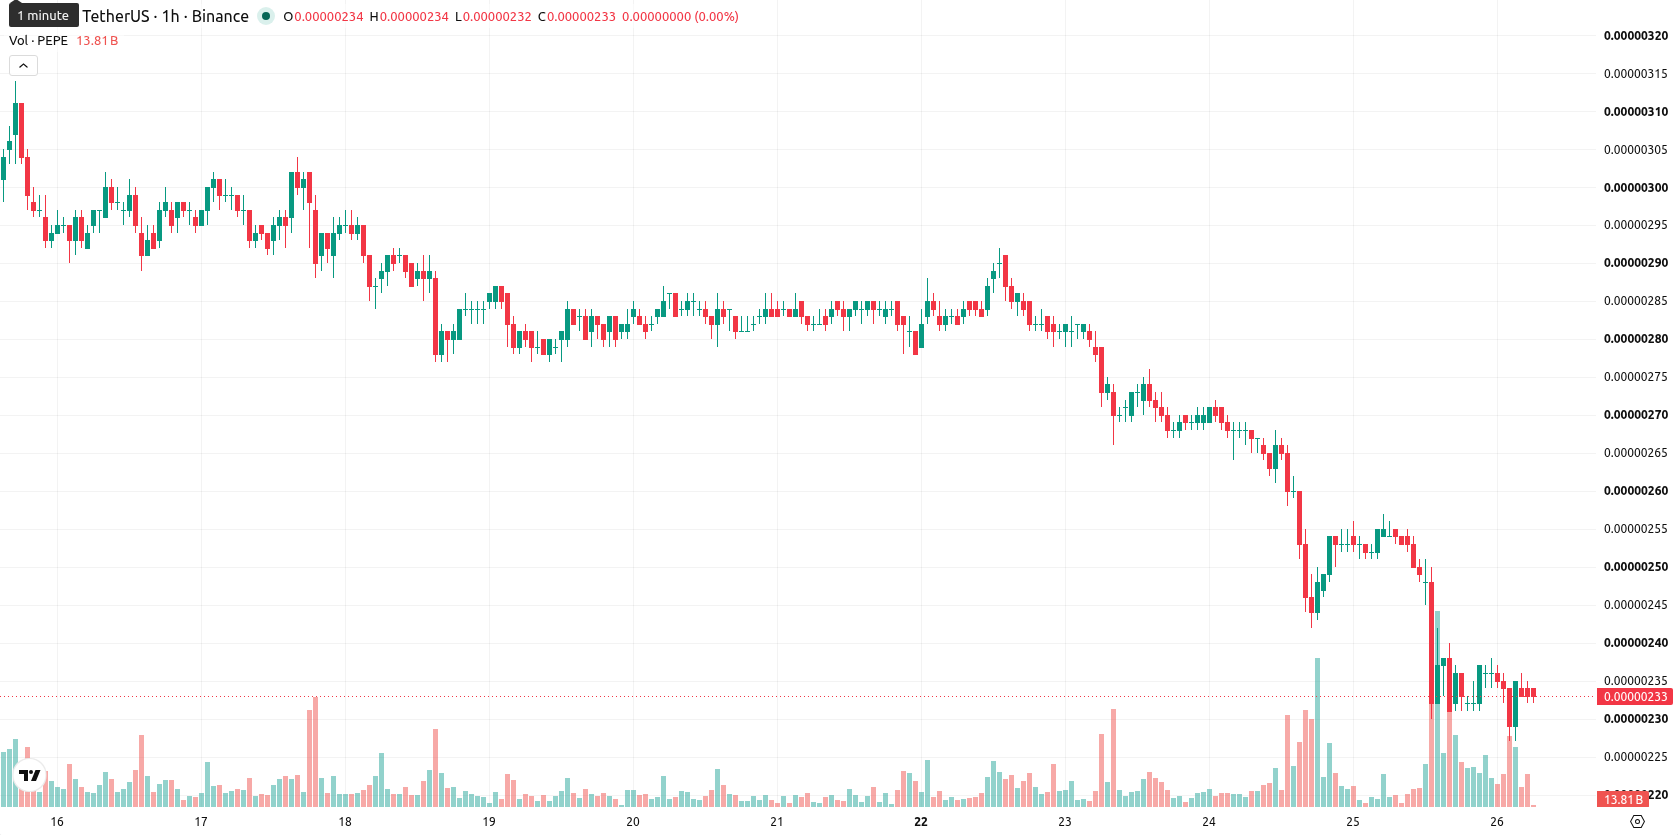
Pepe (PEPE) is trading at $0.0000023 after an 8.24% decline for the session, with price action currently positioned below its short- and medium-term moving averages, and under longer-term trend levels.
Highlights
- PEPE/USD faces sustained bearish momentum, trading well below key moving averages across all timeframes.
- Multiple technical indicators show strong downward momentum, with sellers in control and little evidence of buying pressure.
- Near-term trading is likely to remain in the $0.000002161–$0.000002439 range, with high downside probability if support breaks.
Bearish momentum persists as support levels see heightened volatility
On the technical front, PEPE/USD is trading below the 20-period and 50-period moving averages on the one-hour chart, and remains significantly under the 200-period moving average on the daily timeframe. The Ichimoku Kijun currently stands at $0.00000242 and serves as immediate resistance. Relative Strength Index (RSI) sits at 39 in oversold territory, while the Commodity Channel Index (CCI) and Bull/Bear Power both indicate persistent dominance by sellers. The Moving Average Convergence Divergence (MACD) and Average Directional Index (ADX) confirm strong bearish momentum and trend strength. The Stochastic RSI is flagged as overbought, signaling weak short-term buying pressure, and the Awesome Oscillator aligns with the broader downside bias. Price closed near the session low amid elevated volatility and a modest downside gap.
Further downside seen as support break risk increases
Looking ahead, the most probable scenario over the next two to three sessions is for PEPE/USD to remain within a narrow volatility band between $0.000002161 and $0.000002439. The likelihood of a bullish reversal is very low, while the probability of further downside moves is high if $0.000002161 support breaks. Any bullish scenario would require a clear breakout above the $0.00000242 resistance level.
In a recent review, analysts highlighted persistent bearish momentum and a lack of immediate reversal prospects for Pepe. The latest technical signals reinforce this negative outlook, with traders now advised to watch for a decisive break below $0.000002161 as a potential trigger for further downside risk.


-
 Afghanistan
-
 Albania
-
 Algeria
-
 Angola
-
 Argentina
-
 Armenia
-
 Australia
-
 Austria
-
 Azerbaijan
-
 Bahamas
-
 Bahrain
-
 Bangladesh
-
 Belarus
-
 Belgium
-
 Bolivia
-
 Botswana
-
 Brazil
-
 Brunei
-
 Bulgaria
-
 Cambodia
-
 Cameroon
-
 Canada
-
 Chile
Chile
-
 China
China
-
 Colombia
-
 Congo
Congo
-
 Costa Rica
-
 Cote d'Ivoire
-
 Croatia
-
 Cuba
Cuba
-
 Cyprus
-
 Czechia
-
 DR Congo
-
 Denmark
-
 Dominican Republic
-
 Ecuador
-
 Egypt
Egypt
-
 El Salvador
-
 Estonia
-
 Eswatini
-
 Ethiopia
-
 Finland
-
 France
-
 Georgia
-
 Germany
-
 Ghana
Ghana
-
 Greece
-
 Haiti
Haiti
-
 Hong Kong
-
 Hungary
-
 India
India
-
 Indonesia
-
 Iran, Islamic republic
-
 Iraq
Iraq
-
 Ireland
-
 Israel
-
 Italy
Italy
-
 Jamaica
-
 Japan
Japan
-
 Jordan
-
 Kazakhstan
-
 Kenya
Kenya
-
 Korea
Korea
-
 Kuwait
-
 Kyrgyzstan
-
 Laos
Laos
-
 Latvia
-
 Lebanon
-
 Lesotho
-
 Libya
Libya
-
 Lithuania
-
 Luxembourg
-
 Madagascar
-
 Malaysia
-
 Malta
Malta
-
 Mauritius
-
 Mexico
-
 Moldova
-
 Mongolia
-
 Montenegro
-
 Morocco
-
 Mozambique
-
 Myanmar
-
 Namibia
-
 Nepal
Nepal
-
 Netherlands
-
 New Zealand
-
 Nigeria
-
 North Macedonia
-
 Norway
-
 Oman
Oman
-
 Pakistan
-
 Palestine
-
 Panama
-
 Papua New Guinea
-
 Paraguay
-
 Peru
Peru
-
 Philippines
-
 Poland
-
 Portugal
-
 Puerto Rico
-
 Qatar
Qatar
-
 Reunion
-
 Romania
-
 Rwanda
-
 Saudi Arabia
-
 Serbia
-
 Singapore
-
 Slovakia
-
 Slovenia
-
 Somalia
-
 South Africa
-
 Spain
Spain
-
 Sri Lanka
-
 Sweden
-
 Switzerland
-
 Syria
Syria
-
 Taiwan
-
 Tajikistan
-
 Tanzania
-
 Thailand
-
 Trinidad and Tobago
-
 Tunisia
-
 Turkey
-
 UAE
UAE
-
 Uganda
-
 Ukraine
-
 United Kingdom
-
United States
-
 Uruguay
-
 Uzbekistan
-
 Venezuela
-
 Vietnam
-
 Yemen
Yemen
-
 Zambia
-
 Zimbabwe
- Forex
- Crypto
