
Solana price prediction: Holding $65.97 support? SOL trades down

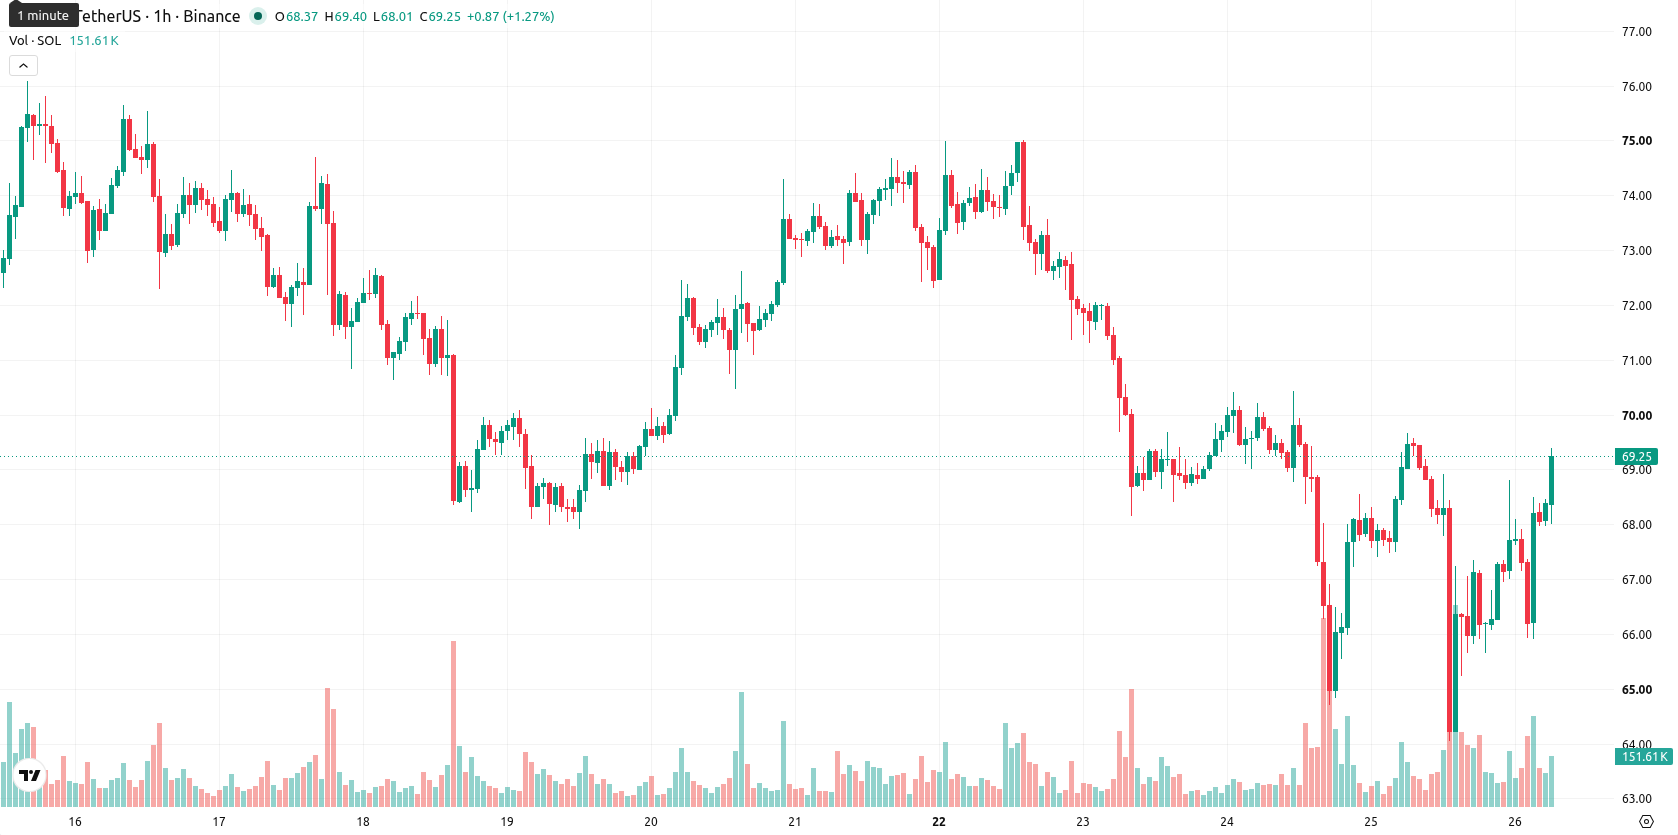
Solana (SOL) is trading at $68.42 after slipping narrowly today, holding above its short- and medium-term moving averages while remaining below its long-term average. The asset has shown resilience by staying near recent highs during a volatile session.
Highlights
- Solana's blockchain surpassed $10 billion in cumulative tokenized equities volume, capturing over 95% of global market share in this sector.
- Institutional validation is rising, with MoneyGram and Coinbase enhancing on-chain activity and network credibility for institutional adoption.
- SOL/USD trades in a volatile corridor around $68, with key support at $65.97; technicals signal short-term buyer dominance, but long-term momentum remains bearish.
Institutional gains and ETF listing fuel tokenized equity dominance
Solana surpassed $10 billion in cumulative tokenized equities volume transacted on its blockchain, a milestone attributed in part to persistent demand for SpaceX tokenized shares, according to Cryptobriefing. The network has further established itself in the tokenized equities space by capturing over 95% of the global share and expanding its real-world asset ecosystem to $3.1 billion in total value, enhancing appeal for both enterprise and institutional users as reported by Cryptobriefing. Institutional adoption was reflected in MoneyGram becoming an active validator and Coinbase integrating its validator with the DoubleZero Edge fiber network to improve on-chain trading performance, with coverage by Thefintechtimes and Cryptobriefing. The listing of the Volatility Shares Solana ETF on KASE in Kazakhstan, reported by Cryptobriefing, additionally opens regulated SOL exposure to Central Asian investors, though price action has remained under broader selling pressure.
Divergent momentum signals amid short-term support and overbought risk
On the technical side, SOL/USD trades above the 20-period ($67.09) and 50-period ($67.88) moving averages on the hourly chart, but remains well below the 200-period ($96.16) moving average on the daily timeframe. Immediate support is marked by the Ichimoku Kijun level at $66.85. The Moving Average Convergence Divergence (MACD) signals strong selling momentum, while the Average Directional Index (ADX) is neutral, suggesting a lack of a clear intraday trend. The Relative Strength Index (RSI) stands at 53.44 in Buy territory and the Commodity Channel Index (CCI) also indicates a Buy, but both Bull/Bear Power and the Stochastic RSI show overbought conditions. The Awesome Oscillator is neutral, pointing to a technically mixed setup with both short-term buyer dominance and signals of elevated risk.
Consolidation likely as breakout scenarios define near-term risks
In the near term, the estimated price range for SOL/USD is $65.97 to $72.23, with a modestly higher probability of an upward move at 53% versus 47% to the downside. The baseline scenario envisions price consolidating within this range given current volatility. Should SOL/USD break above the upper boundary, a bullish extension is possible. A break below immediate support at $65.97 would point to renewed downside risk.
Earlier, analysts noted that Solana continued to face persistent selling pressure and lacked strong bullish catalysts, with technicals reflecting a bearish overall outlook. While the latest developments highlight sustained institutional engagement and emerging sectors like tokenized equities, traders should monitor for a confirmed breakout above $72.23 as validation of a shift in short-term market sentiment.


-
 Afghanistan
-
 Albania
-
 Algeria
-
 Angola
-
 Argentina
-
 Armenia
-
 Australia
-
 Austria
-
 Azerbaijan
-
 Bahamas
-
 Bahrain
-
 Bangladesh
-
 Belarus
-
 Belgium
-
 Bolivia
-
 Botswana
-
 Brazil
-
 Brunei
-
 Bulgaria
-
 Cambodia
-
 Cameroon
-
 Canada
-
 Chile
Chile
-
 China
China
-
 Colombia
-
 Congo
Congo
-
 Costa Rica
-
 Cote d'Ivoire
-
 Croatia
-
 Cuba
Cuba
-
 Cyprus
-
 Czechia
-
 DR Congo
-
 Denmark
-
 Dominican Republic
-
 Ecuador
-
 Egypt
Egypt
-
 El Salvador
-
 Estonia
-
 Eswatini
-
 Ethiopia
-
 Finland
-
 France
-
 Georgia
-
 Germany
-
 Ghana
Ghana
-
 Greece
-
 Haiti
Haiti
-
 Hong Kong
-
 Hungary
-
 India
India
-
 Indonesia
-
 Iran, Islamic republic
-
 Iraq
Iraq
-
 Ireland
-
 Israel
-
 Italy
Italy
-
 Jamaica
-
 Japan
Japan
-
 Jordan
-
 Kazakhstan
-
 Kenya
Kenya
-
 Korea
Korea
-
 Kuwait
-
 Kyrgyzstan
-
 Laos
Laos
-
 Latvia
-
 Lebanon
-
 Lesotho
-
 Libya
Libya
-
 Lithuania
-
 Luxembourg
-
 Madagascar
-
 Malaysia
-
 Malta
Malta
-
 Mauritius
-
 Mexico
-
 Moldova
-
 Mongolia
-
 Montenegro
-
 Morocco
-
 Mozambique
-
 Myanmar
-
 Namibia
-
 Nepal
Nepal
-
 Netherlands
-
 New Zealand
-
 Nigeria
-
 North Macedonia
-
 Norway
-
 Oman
Oman
-
 Pakistan
-
 Palestine
-
 Panama
-
 Papua New Guinea
-
 Paraguay
-
 Peru
Peru
-
 Philippines
-
 Poland
-
 Portugal
-
 Puerto Rico
-
 Qatar
Qatar
-
 Reunion
-
 Romania
-
 Rwanda
-
 Saudi Arabia
-
 Serbia
-
 Singapore
-
 Slovakia
-
 Slovenia
-
 Somalia
-
 South Africa
-
 Spain
Spain
-
 Sri Lanka
-
 Sweden
-
 Switzerland
-
 Syria
Syria
-
 Taiwan
-
 Tajikistan
-
 Tanzania
-
 Thailand
-
 Trinidad and Tobago
-
 Tunisia
-
 Turkey
-
 UAE
UAE
-
 Uganda
-
 Ukraine
-
 United Kingdom
-
United States
-
 Uruguay
-
 Uzbekistan
-
 Venezuela
-
 Vietnam
-
 Yemen
Yemen
-
 Zambia
-
 Zimbabwe
- Forex
- Crypto
