
Solana under pressure with current volatility holding near 16 percent: weekly review

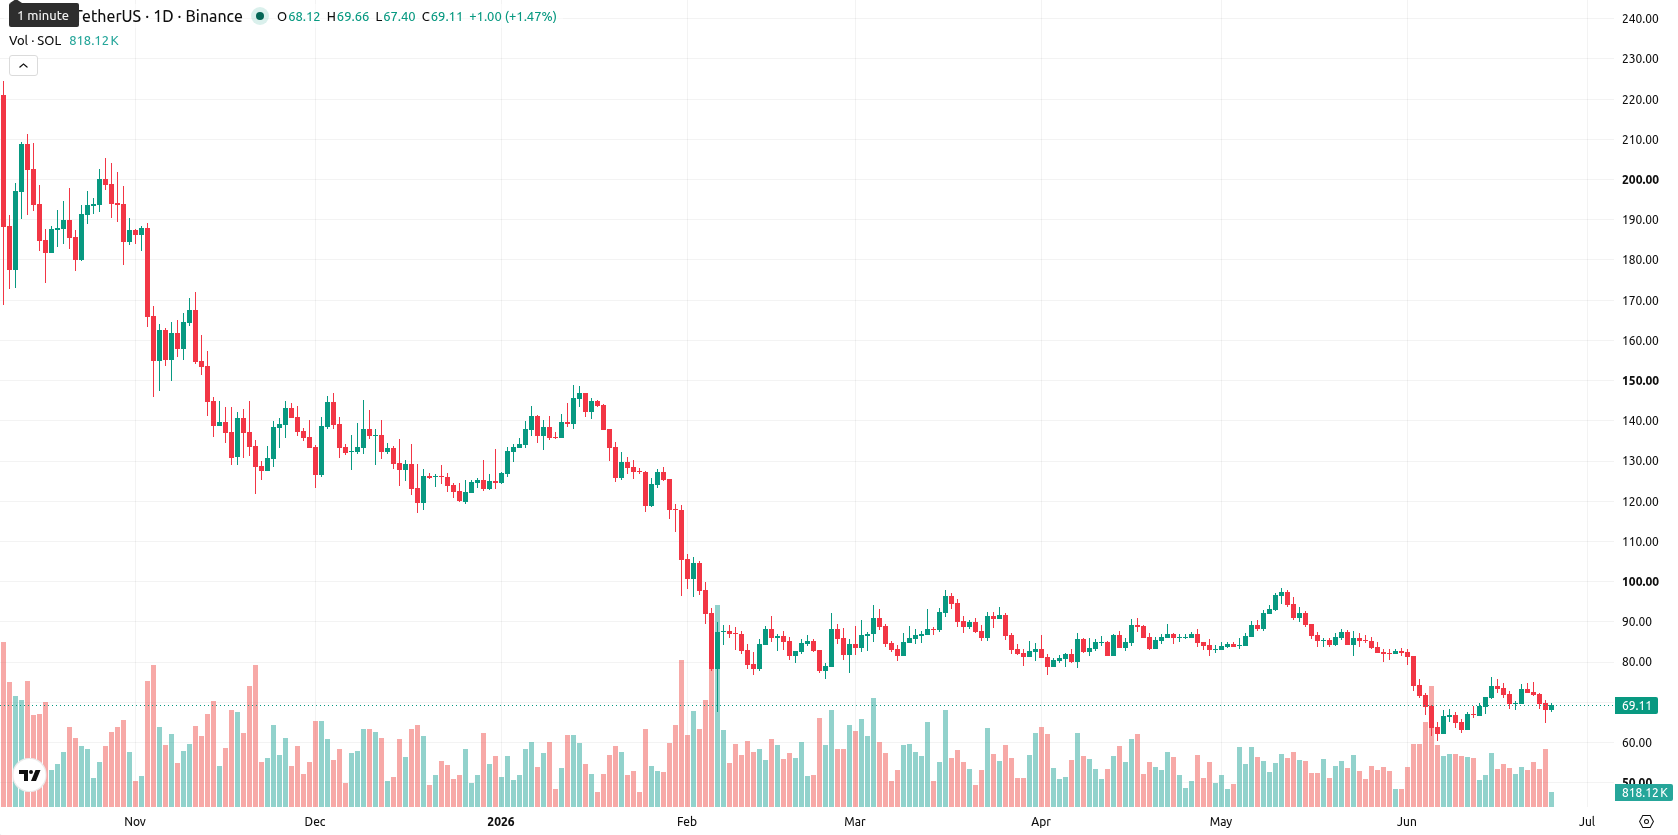
Solana (SOL) is currently trading at $68.99, reflecting a weekly decline of $2.92 or 4.06%. The asset sits well below its weekly MA-20 ($81.96), MA-50 ($132.86), and MA-200 ($106.86), underscoring persistent medium- and long-term downside pressure in the current environment.
Highlights
- Solana trades well below key moving averages, reflecting sustained medium- and long-term bearish pressure.
- Momentum indicators confirm persistent downside with strong selling control, though multiple signals suggest an oversold environment.
- SOL is projected to trade between $64.00 and $74.00 over the next week, with sideways movement favored unless $64.00 is breached.
Ecosystem expansion and exchange inflows shape weekly sentiment
MoneyGram has joined the Solana network as a validator and is participating in expanding stablecoin and payments infrastructure through the Solana Developer Platform. In South Korea, Toss Bank has partnered with the Solana Foundation to trial stablecoin payments for cross-border remittances, while Solana-based DeFi applications such as Jupiter are expanding operations with ongoing institutional interest and new regulatory developments. Recent on-chain data also indicates increased SOL transfers to exchanges, with the circulating supply currently at 580.4 million tokens.
Bearish momentum prevails with oversold signals intensifying over the week
Weekly momentum indicators for SOL remain bearish: MACD points to strong downside momentum and the ADX reading at 26.70 signals prevailing seller control. The weekly RSI sits deeply in oversold territory at 33.61, with Stochastic RSI (19.86) and CCI (-172.71) confirming oversold conditions, even as Bull/Bear Power stays decisively negative. Support is seen at $64.00 with resistance near $74.00, while volatility over the week stood at 15.90%. SOL currently trades in the middle of its weekly range and well below all key moving averages, with dynamic resistance at the MA-20 ($81.96).
Sideways range expected as oversold conditions constrain breakout risk
Over the next 7 days, the weekly forecast for SOL suggests movement between $64.00 and $74.00, centered around current levels. With all key momentum and trend indicators pointing bearish and none signaling a buy, there is a low probability (less than 20%) of a sustained upward move. The base case scenario anticipates sideways trading within this corridor, as multiple oversold signals could cap further immediate downside. A break above $74.00 would be required to shift momentum favorably, while renewed selling could see a retest below $64.00 before potential relief from oversold conditions.
Earlier, analysts noted that while Solana had shown greater resilience than Bitcoin, its outlook remained heavily tied to broader crypto market trends. The current environment reinforces these concerns, and with momentum still negative despite oversold conditions, traders should monitor for any decisive break above $74.00 as a signal of potential trend reversal.


-
 Afghanistan
-
 Albania
-
 Algeria
-
 Angola
-
 Argentina
-
 Armenia
-
 Australia
-
 Austria
-
 Azerbaijan
-
 Bahamas
-
 Bahrain
-
 Bangladesh
-
 Belarus
-
 Belgium
-
 Bolivia
-
 Botswana
-
 Brazil
-
 Brunei
-
 Bulgaria
-
 Cambodia
-
 Cameroon
-
 Canada
-
 Chile
Chile
-
 China
China
-
 Colombia
-
 Congo
Congo
-
 Costa Rica
-
 Cote d'Ivoire
-
 Croatia
-
 Cuba
Cuba
-
 Cyprus
-
 Czechia
-
 DR Congo
-
 Denmark
-
 Dominican Republic
-
 Ecuador
-
 Egypt
Egypt
-
 El Salvador
-
 Estonia
-
 Eswatini
-
 Ethiopia
-
 Finland
-
 France
-
 Georgia
-
 Germany
-
 Ghana
Ghana
-
 Greece
-
 Haiti
Haiti
-
 Hong Kong
-
 Hungary
-
 India
India
-
 Indonesia
-
 Iran, Islamic republic
-
 Iraq
Iraq
-
 Ireland
-
 Israel
-
 Italy
Italy
-
 Jamaica
-
 Japan
Japan
-
 Jordan
-
 Kazakhstan
-
 Kenya
Kenya
-
 Korea
Korea
-
 Kuwait
-
 Kyrgyzstan
-
 Laos
Laos
-
 Latvia
-
 Lebanon
-
 Lesotho
-
 Libya
Libya
-
 Lithuania
-
 Luxembourg
-
 Madagascar
-
 Malaysia
-
 Malta
Malta
-
 Mauritius
-
 Mexico
-
 Moldova
-
 Mongolia
-
 Montenegro
-
 Morocco
-
 Mozambique
-
 Myanmar
-
 Namibia
-
 Nepal
Nepal
-
 Netherlands
-
 New Zealand
-
 Nigeria
-
 North Macedonia
-
 Norway
-
 Oman
Oman
-
 Pakistan
-
 Palestine
-
 Panama
-
 Papua New Guinea
-
 Paraguay
-
 Peru
Peru
-
 Philippines
-
 Poland
-
 Portugal
-
 Puerto Rico
-
 Qatar
Qatar
-
 Reunion
-
 Romania
-
 Rwanda
-
 Saudi Arabia
-
 Serbia
-
 Singapore
-
 Slovakia
-
 Slovenia
-
 Somalia
-
 South Africa
-
 Spain
Spain
-
 Sri Lanka
-
 Sweden
-
 Switzerland
-
 Syria
Syria
-
 Taiwan
-
 Tajikistan
-
 Tanzania
-
 Thailand
-
 Trinidad and Tobago
-
 Tunisia
-
 Turkey
-
 UAE
UAE
-
 Uganda
-
 Ukraine
-
 United Kingdom
-
United States
-
 Uruguay
-
 Uzbekistan
-
 Venezuela
-
 Vietnam
-
 Yemen
Yemen
-
 Zambia
-
 Zimbabwe
- Forex
- Crypto
