
Solana price prediction: Will $67.57 support hold? SOL trades down

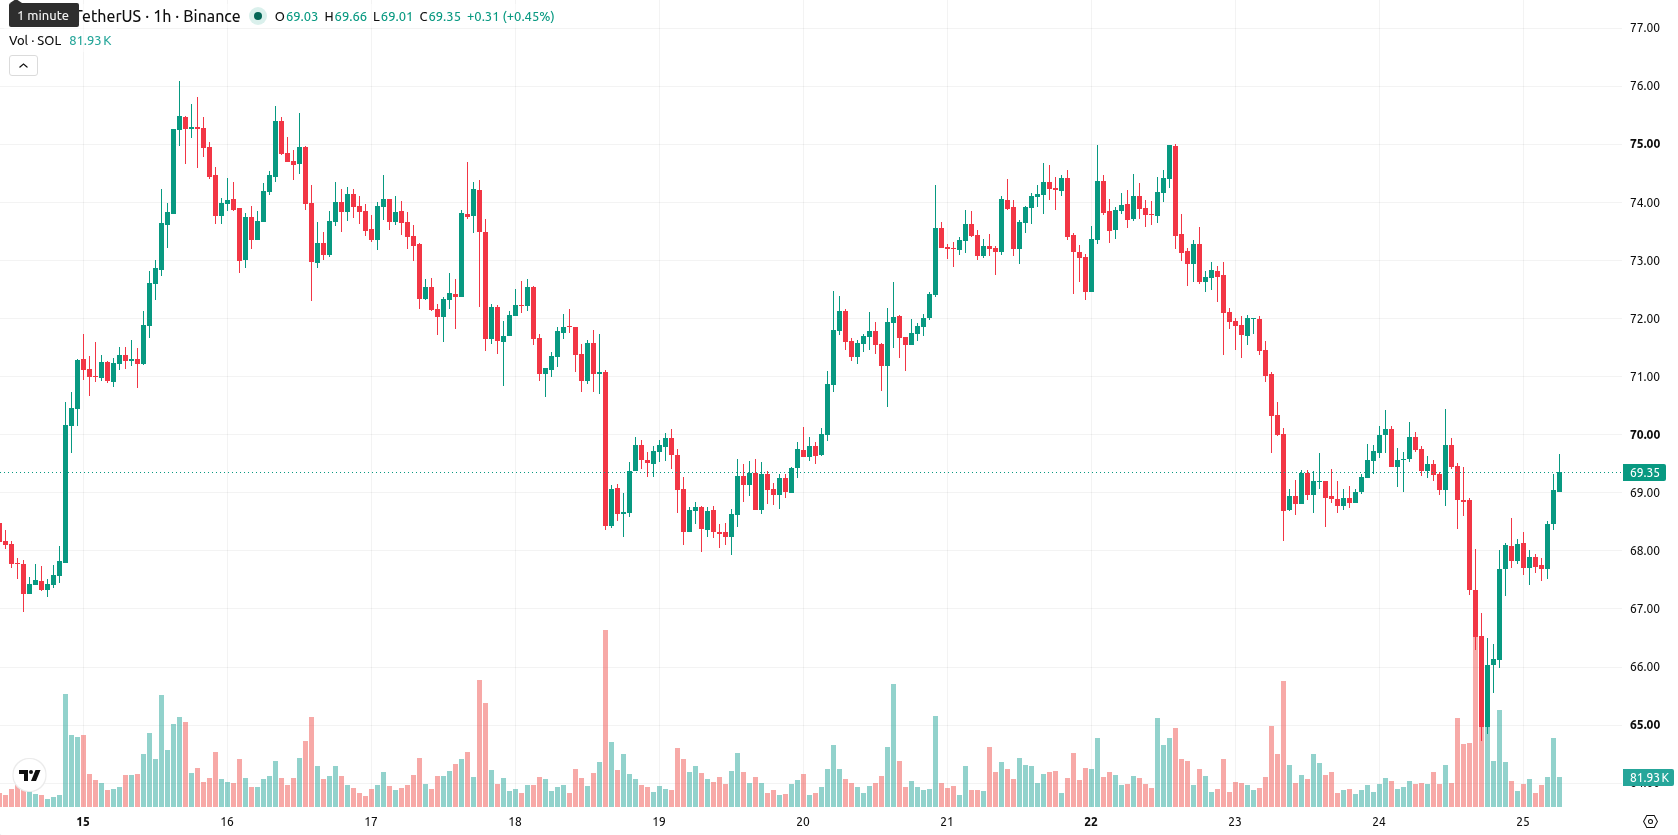
Solana (SOL) is trading at $69.12, down 1.19% on the day. The price remains above its short- and medium-term moving averages, yet continues to sit well below its long-term average.
Highlights
- Goldman Sachs fully exited its $108 million positions in spot Solana ETF and trusts, intensifying institutional capital outflows from Solana.
- Despite capital flight, Solana network adoption continues as MoneyGram launches a validator and Toss Bank partners for South Korean stablecoin payments.
- Technical outlook is bearish with momentum signaling further downside; SOL/USD expected to trade between $66.13 and $71.42 over the next 2-3 days.
Institutional outflows and new validators reshape support dynamics
Goldman Sachs fully liquidated its $108 million holdings in spot Solana ETF and trust products, signaling a significant withdrawal of institutional capital and reducing a key source of support, according to Tradingkey. This move coincided with ongoing net capital outflows from US-listed spot Solana exchange-traded funds, further removing financial inflows and contributing to a more supply-driven environment. Meanwhile, MoneyGram launched a validator node on the Solana network and joined its institutional developer platform, as reported by Forklog, while Toss Bank and the Solana Foundation partnered to test blockchain-based global stablecoin payments aimed at 15 million customers in South Korea, as noted by Criptolog.
Intraday volatility rises as technicals signal prevailing downside
On the hourly chart, SOL/USD remains above the MA-20 at $67.84 and MA-50 at $68.88, providing near-term support, but sits well below the long-term MA-200 at $96.48. The Ichimoku Kijun is positioned at $67.57, acting as immediate support. Momentum readings are largely negative: the Moving Average Convergence Divergence (MACD) shows a Strong Sell, the Average Directional Index (ADX) confirms prevailing selling strength, and the Relative Strength Index (RSI) stands at 45.12, suggesting a Sell bias. However, the Stochastic RSI is Overbought, the Commodity Channel Index (CCI) is Neutral, and Bull/Bear Power indicates sellers retain dominance, all while the Awesome Oscillator supports a prevailing downward momentum. This mix reveals intraday volatility and some short-term indicator divergence.
Bearish breakout risk elevated within narrow trading corridor
For the next 2-3 trading days, SOL is expected to remain within the volatility band of $66.13 to $71.42. The probability of a downward move is higher at 74%, while an upward move carries a 26% chance. Primary expectations are for the price to remain constrained within this corridor. A breakout above $71.42 would open a bullish scenario, while a decline below $67.57 signals renewed bearish momentum.
Earlier, analysts noted that Solana faced persistent bearish momentum amid regulatory uncertainty and institutional outflows, highlighting downside risks. Fresh evidence of major institutional withdrawals and continued net outflows reinforces this negative outlook, making the price’s hold above $67.57 a pivotal level for traders to monitor in the days ahead.


-
 Afghanistan
-
 Albania
-
 Algeria
-
 Angola
-
 Argentina
-
 Armenia
-
 Australia
-
 Austria
-
 Azerbaijan
-
 Bahamas
-
 Bahrain
-
 Bangladesh
-
 Belarus
-
 Belgium
-
 Bolivia
-
 Botswana
-
 Brazil
-
 Brunei
-
 Bulgaria
-
 Cambodia
-
 Cameroon
-
 Canada
-
 Chile
Chile
-
 China
China
-
 Colombia
-
 Congo
Congo
-
 Costa Rica
-
 Cote d'Ivoire
-
 Croatia
-
 Cuba
Cuba
-
 Cyprus
-
 Czechia
-
 DR Congo
-
 Denmark
-
 Dominican Republic
-
 Ecuador
-
 Egypt
Egypt
-
 El Salvador
-
 Estonia
-
 Eswatini
-
 Ethiopia
-
 Finland
-
 France
-
 Georgia
-
 Germany
-
 Ghana
Ghana
-
 Greece
-
 Haiti
Haiti
-
 Hong Kong
-
 Hungary
-
 India
India
-
 Indonesia
-
 Iran, Islamic republic
-
 Iraq
Iraq
-
 Ireland
-
 Israel
-
 Italy
Italy
-
 Jamaica
-
 Japan
Japan
-
 Jordan
-
 Kazakhstan
-
 Kenya
Kenya
-
 Korea
Korea
-
 Kuwait
-
 Kyrgyzstan
-
 Laos
Laos
-
 Latvia
-
 Lebanon
-
 Lesotho
-
 Libya
Libya
-
 Lithuania
-
 Luxembourg
-
 Madagascar
-
 Malaysia
-
 Malta
Malta
-
 Mauritius
-
 Mexico
-
 Moldova
-
 Mongolia
-
 Montenegro
-
 Morocco
-
 Mozambique
-
 Myanmar
-
 Namibia
-
 Nepal
Nepal
-
 Netherlands
-
 New Zealand
-
 Nigeria
-
 North Macedonia
-
 Norway
-
 Oman
Oman
-
 Pakistan
-
 Palestine
-
 Panama
-
 Papua New Guinea
-
 Paraguay
-
 Peru
Peru
-
 Philippines
-
 Poland
-
 Portugal
-
 Puerto Rico
-
 Qatar
Qatar
-
 Reunion
-
 Romania
-
 Rwanda
-
 Saudi Arabia
-
 Serbia
-
 Singapore
-
 Slovakia
-
 Slovenia
-
 Somalia
-
 South Africa
-
 Spain
Spain
-
 Sri Lanka
-
 Sweden
-
 Switzerland
-
 Syria
Syria
-
 Taiwan
-
 Tajikistan
-
 Tanzania
-
 Thailand
-
 Trinidad and Tobago
-
 Tunisia
-
 Turkey
-
 UAE
UAE
-
 Uganda
-
 Ukraine
-
 United Kingdom
-
United States
-
 Uruguay
-
 Uzbekistan
-
 Venezuela
-
 Vietnam
-
 Yemen
Yemen
-
 Zambia
-
 Zimbabwe
- Forex
- Crypto
