
Steady price for Solana as $69.85 resistance limits gains

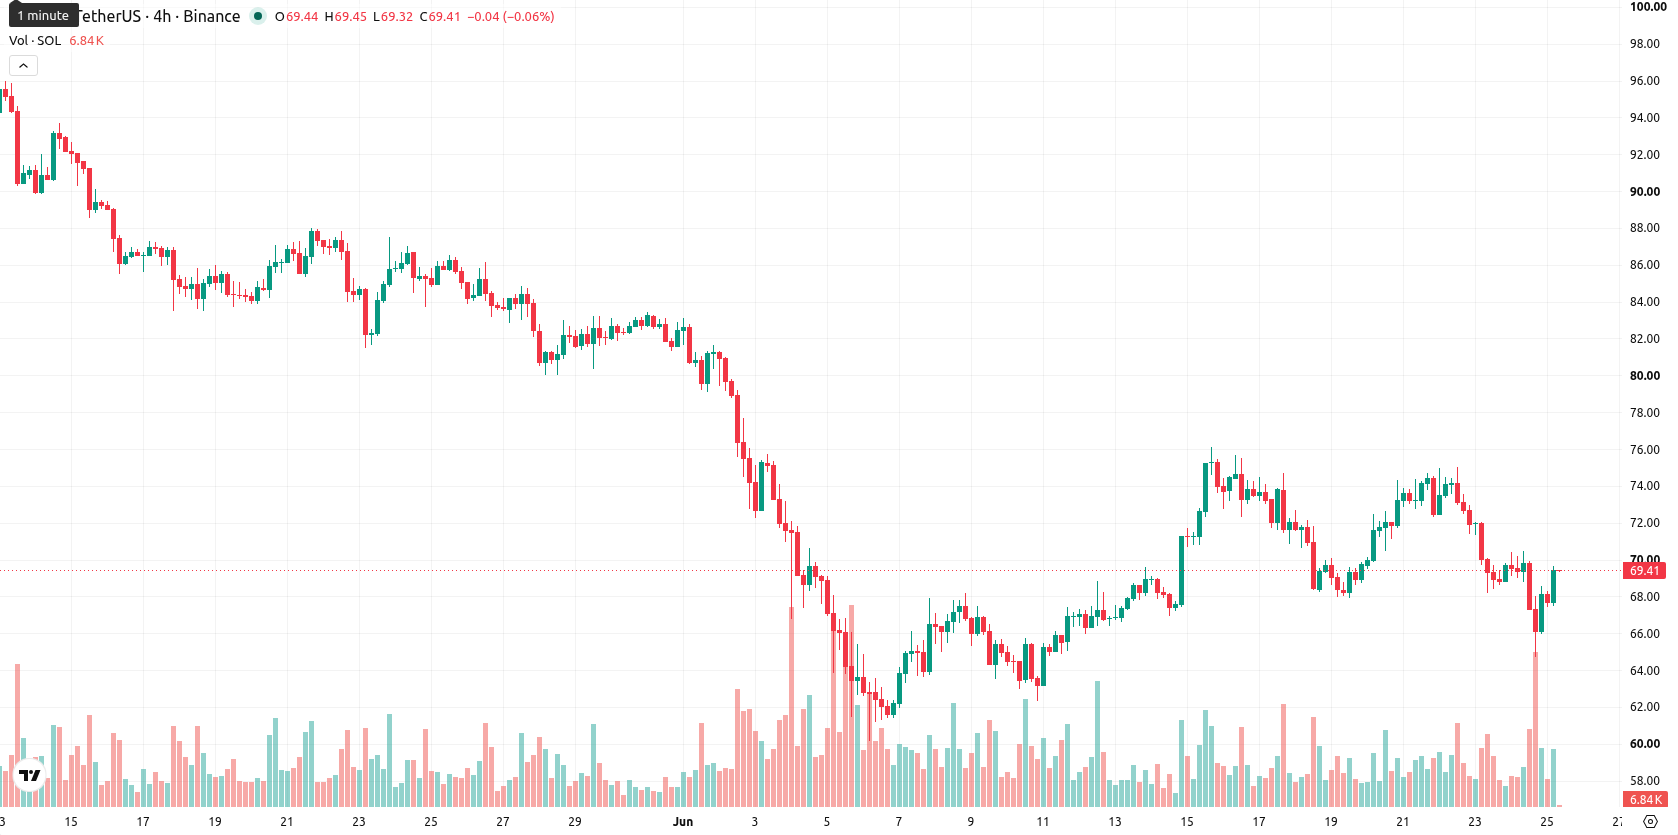
Solana (SOL) is trading at $69.47, posting a modest daily gain. The price currently sits below its key moving averages, reflecting a weak tone relative to short- and medium-term trend levels.
Highlights
- Goldman Sachs liquidated its $108 million position in spot Solana ETFs and trusts, signaling institutional withdrawal from Solana products.
- Goldman's exit triggered net outflows from US-listed Solana ETFs, tightening market liquidity and intensifying price swings.
- SOL/USD remains under sustained bearish momentum, with technical indicators pointing to high probability of a decline toward the $64.87 to $74.07 range.
Institutional exit sparks supply pressure and capital outflows
Goldman Sachs fully liquidated its $108 million position in spot Solana ETF and trust holdings, removing a major source of institutional capital from Solana-tied investment products, according to Tradingkey. This decisive corporate action has increased downward supply pressure and signals a broader retreat by institutional investors. Tradingkey also reported that the Goldman exit led to net capital outflows from US-listed spot Solana exchange-traded funds, curbing market liquidity and possibly amplifying recent price volatility.
Technical resistance and weak momentum reinforce bearish sentiment
On the H4 timeframe, SOL is positioned below the 20-period moving average at $70.44 and the 50-period moving average at $71.07. On the daily chart, it remains under the 200-period moving average at $96.48, with the Ichimoku Kijun level of $69.85 acting as immediate resistance. The Relative Strength Index (RSI) is at 38.28, reflecting weak momentum. The Average Directional Index (ADX) and the Moving Average Convergence Divergence (MACD) both indicate a sell trend, while the Commodity Channel Index (CCI) also signals a bearish bias. Stochastic RSI is neutral, and Bull/Bear Power shows oversold conditions, confirming dominance by sellers on an intraday basis. The Awesome Oscillator is aligned with this prevailing downside trend.
Downside risk elevated as breakout odds remain low
Over the next 2–3 trading days, a typical volatility band for SOL/USD is expected between $64.87 and $74.07. The probability of a meaningful upward breakout remains very low (less than 20 percent), with the likelihood of further downside far higher. The baseline scenario is continued sideways price action within this corridor. For any bullish reversal to gain traction, SOL will need to clear immediate resistance near $69.85, while a confirmed move below support at $64.87 may accelerate bearish momentum.
Earlier, analysts noted that Solana was experiencing persistent bearish momentum due to institutional outflows and elevated downside risk. The current trend not only reinforces this bearish outlook but also makes a decisive move below $64.87 an important threshold for triggering potential accelerated declines in the near term.


-
 Afghanistan
-
 Albania
-
 Algeria
-
 Angola
-
 Argentina
-
 Armenia
-
 Australia
-
 Austria
-
 Azerbaijan
-
 Bahamas
-
 Bahrain
-
 Bangladesh
-
 Belarus
-
 Belgium
-
 Bolivia
-
 Botswana
-
 Brazil
-
 Brunei
-
 Bulgaria
-
 Cambodia
-
 Cameroon
-
 Canada
-
 Chile
Chile
-
 China
China
-
 Colombia
-
 Congo
Congo
-
 Costa Rica
-
 Cote d'Ivoire
-
 Croatia
-
 Cuba
Cuba
-
 Cyprus
-
 Czechia
-
 DR Congo
-
 Denmark
-
 Dominican Republic
-
 Ecuador
-
 Egypt
Egypt
-
 El Salvador
-
 Estonia
-
 Eswatini
-
 Ethiopia
-
 Finland
-
 France
-
 Georgia
-
 Germany
-
 Ghana
Ghana
-
 Greece
-
 Haiti
Haiti
-
 Hong Kong
-
 Hungary
-
 India
India
-
 Indonesia
-
 Iran, Islamic republic
-
 Iraq
Iraq
-
 Ireland
-
 Israel
-
 Italy
Italy
-
 Jamaica
-
 Japan
Japan
-
 Jordan
-
 Kazakhstan
-
 Kenya
Kenya
-
 Korea
Korea
-
 Kuwait
-
 Kyrgyzstan
-
 Laos
Laos
-
 Latvia
-
 Lebanon
-
 Lesotho
-
 Libya
Libya
-
 Lithuania
-
 Luxembourg
-
 Madagascar
-
 Malaysia
-
 Malta
Malta
-
 Mauritius
-
 Mexico
-
 Moldova
-
 Mongolia
-
 Montenegro
-
 Morocco
-
 Mozambique
-
 Myanmar
-
 Namibia
-
 Nepal
Nepal
-
 Netherlands
-
 New Zealand
-
 Nigeria
-
 North Macedonia
-
 Norway
-
 Oman
Oman
-
 Pakistan
-
 Palestine
-
 Panama
-
 Papua New Guinea
-
 Paraguay
-
 Peru
Peru
-
 Philippines
-
 Poland
-
 Portugal
-
 Puerto Rico
-
 Qatar
Qatar
-
 Reunion
-
 Romania
-
 Rwanda
-
 Saudi Arabia
-
 Serbia
-
 Singapore
-
 Slovakia
-
 Slovenia
-
 Somalia
-
 South Africa
-
 Spain
Spain
-
 Sri Lanka
-
 Sweden
-
 Switzerland
-
 Syria
Syria
-
 Taiwan
-
 Tajikistan
-
 Tanzania
-
 Thailand
-
 Trinidad and Tobago
-
 Tunisia
-
 Turkey
-
 UAE
UAE
-
 Uganda
-
 Ukraine
-
 United Kingdom
-
United States
-
 Uruguay
-
 Uzbekistan
-
 Venezuela
-
 Vietnam
-
 Yemen
Yemen
-
 Zambia
-
 Zimbabwe
- Forex
- Crypto
