

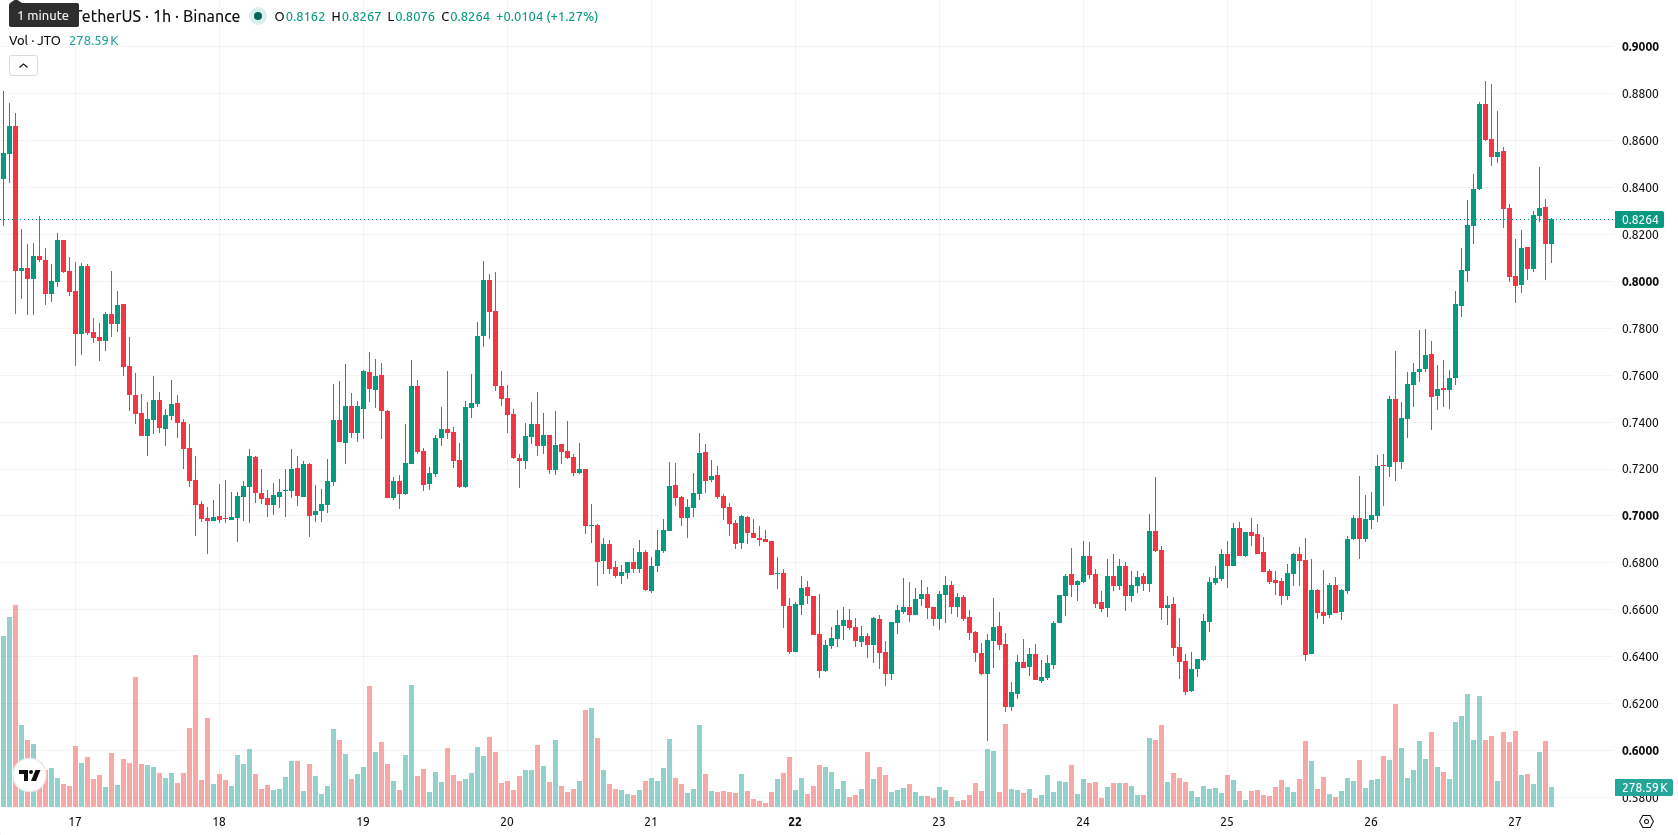
Jito (JTO) is trading at $0.8104, marking a 7.74% gain on the day. The price currently sits below its short-term moving average but remains above medium- and long-term reference levels.
Highlights
- JTO/USD demonstrates medium-term strength and a bullish long-term outlook, despite encountering short-term resistance below its 20-period average.
- Momentum indicators skew bullish with strong buy signals and robust intraday price action, though some oscillators signal caution due to mixed alignment.
- Expected trading range for the next 2–3 sessions is $0.7474 to $0.8734, with a 75% probability favoring upward movement and immediate support at $0.8.
Momentum divergence complicates bullish signals amid technical boundaries
JTO/USD is trading below the 20-day moving average, while remaining above the 50-day and well above the 200-day moving averages. The Ichimoku Kijun support is positioned at $0.8. The Moving Average Convergence Divergence (MACD) is at a strong buy signal, and the Average Directional Index (ADX) points to buying strength. Stochastic RSI is in oversold territory, and the Relative Strength Index (RSI) reads 55.4, indicating a neutral-to-bullish short-term setup. The Commodity Channel Index (CCI) is neutral, Bull/Bear Power favors buyers intraday, while the Awesome Oscillator holds a neutral bias. Price action has shown heightened volatility and there is divergence between oscillators, requiring careful monitoring despite strong momentum readings.
Range-bound outlook as consolidation tempers breakout potential
Over the next 2 to 3 sessions, JTO is projected to trade within a $0.7474 to $0.8734 range, representing the typical volatility band relative to current levels. There is a 75% probability of an upward move and 25% for a downward move, with a baseline expectation of consolidation within this range. A breakout above the upper bound would trigger a bullish scenario, while breakdown below $0.8 support could see price test the lower end of the projected range.
Earlier, analysts noted that Jito was exhibiting sustained bullish momentum, with technical indicators favoring continued upside. The latest data introduce a more mixed short-term outlook, so traders should monitor the $0.8 level as a pivotal support that could define the next market move.


-
 Afghanistan
-
 Albania
-
 Algeria
-
 Angola
-
 Argentina
-
 Armenia
-
 Australia
-
 Austria
-
 Azerbaijan
-
 Bahamas
-
 Bahrain
-
 Bangladesh
-
 Belarus
-
 Belgium
-
 Bolivia
-
 Botswana
-
 Brazil
-
 Brunei
-
 Bulgaria
-
 Cambodia
-
 Cameroon
-
 Canada
-
 Chile
Chile
-
 China
China
-
 Colombia
-
 Congo
Congo
-
 Costa Rica
-
 Cote d'Ivoire
-
 Croatia
-
 Cuba
Cuba
-
 Cyprus
-
 Czechia
-
 DR Congo
-
 Denmark
-
 Dominican Republic
-
 Ecuador
-
 Egypt
Egypt
-
 El Salvador
-
 Estonia
-
 Eswatini
-
 Ethiopia
-
 Finland
-
 France
-
 Georgia
-
 Germany
-
 Ghana
Ghana
-
 Greece
-
 Haiti
Haiti
-
 Hong Kong
-
 Hungary
-
 India
India
-
 Indonesia
-
 Iran, Islamic republic
-
 Iraq
Iraq
-
 Ireland
-
 Israel
-
 Italy
Italy
-
 Jamaica
-
 Japan
Japan
-
 Jordan
-
 Kazakhstan
-
 Kenya
Kenya
-
 Korea
Korea
-
 Kuwait
-
 Kyrgyzstan
-
 Laos
Laos
-
 Latvia
-
 Lebanon
-
 Lesotho
-
 Libya
Libya
-
 Lithuania
-
 Luxembourg
-
 Madagascar
-
 Malaysia
-
 Malta
Malta
-
 Mauritius
-
 Mexico
-
 Moldova
-
 Mongolia
-
 Montenegro
-
 Morocco
-
 Mozambique
-
 Myanmar
-
 Namibia
-
 Nepal
Nepal
-
 Netherlands
-
 New Zealand
-
 Nigeria
-
 North Macedonia
-
 Norway
-
 Oman
Oman
-
 Pakistan
-
 Palestine
-
 Panama
-
 Papua New Guinea
-
 Paraguay
-
 Peru
Peru
-
 Philippines
-
 Poland
-
 Portugal
-
 Puerto Rico
-
 Qatar
Qatar
-
 Reunion
-
 Romania
-
 Rwanda
-
 Saudi Arabia
-
 Serbia
-
 Singapore
-
 Slovakia
-
 Slovenia
-
 Somalia
-
 South Africa
-
 Spain
Spain
-
 Sri Lanka
-
 Sweden
-
 Switzerland
-
 Syria
Syria
-
 Taiwan
-
 Tajikistan
-
 Tanzania
-
 Thailand
-
 Trinidad and Tobago
-
 Tunisia
-
 Turkey
-
 UAE
UAE
-
 Uganda
-
 Ukraine
-
 United Kingdom
-
United States
-
 Uruguay
-
 Uzbekistan
-
 Venezuela
-
 Vietnam
-
 Yemen
Yemen
-
 Zambia
-
 Zimbabwe
- Forex
- Crypto
