
Ethereum Foundation policy guide urges decentralized governance recognition drives Ethereum up

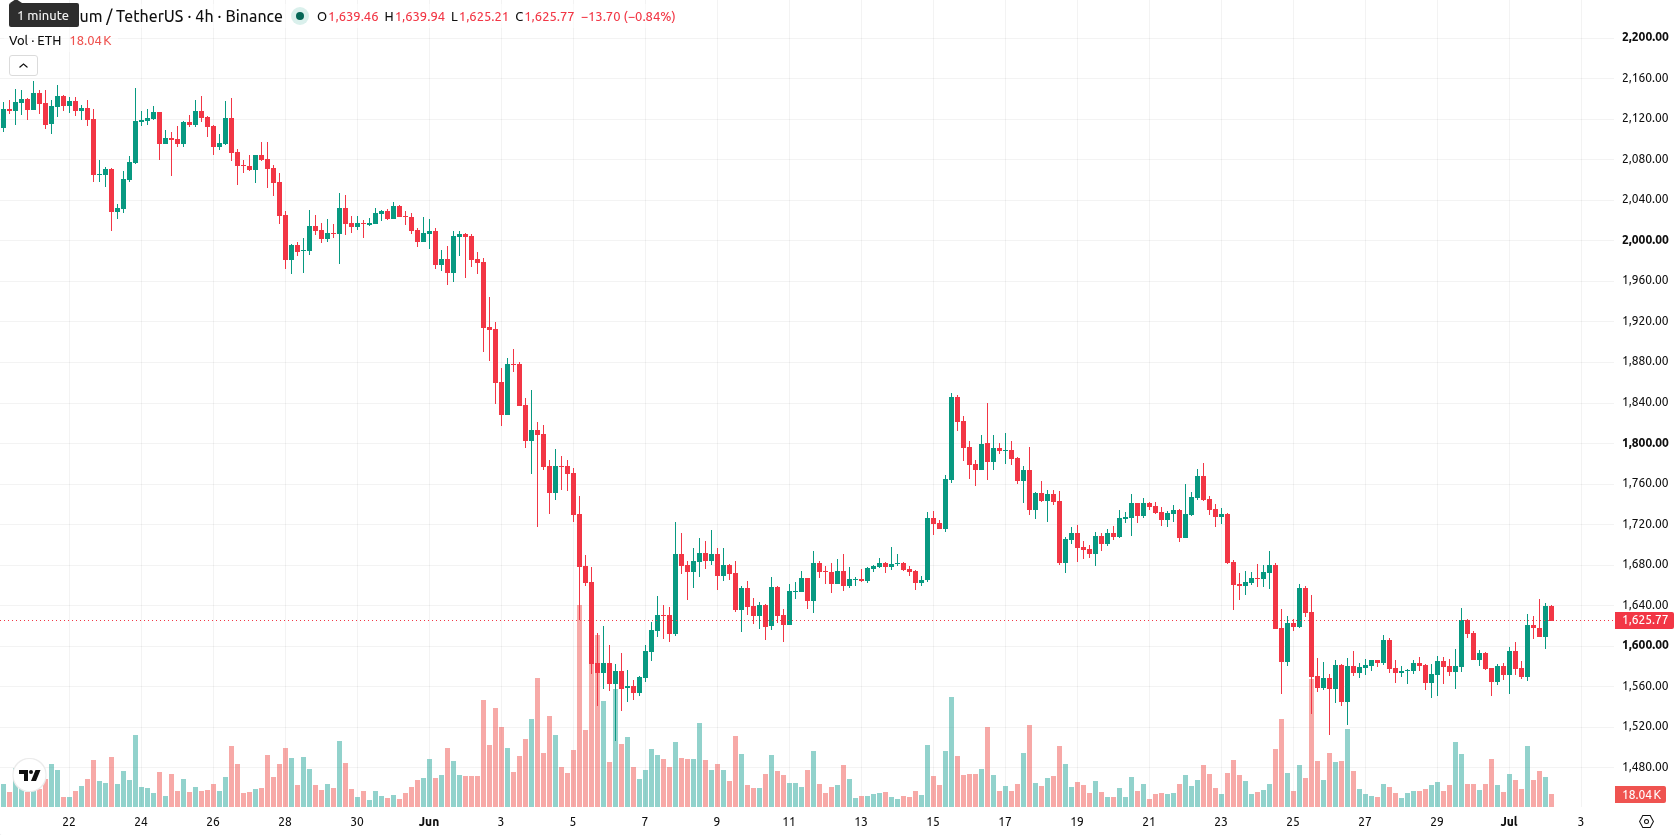
Ethereum (ETH) is trading at $1,603, up 1.78% for the day, positioning itself above its key moving averages in the short and medium term yet still below longer-term levels.
Highlights
- The Ethereum Foundation urges policymakers to distinguish public blockchains like Ethereum from corporate-controlled networks, potentially influencing future regulation and adoption.
- Growing attention to Ethereum's decentralized governance structure is increasing institutional engagement and highlighting its differentiation from other blockchain projects.
- ETH/USD trades with short-term bullish momentum but faces mixed indicator signals, with an expected four-day range of $1,537 to $1,663 and slight downside bias.
Policymaker focus rises as Ethereum Foundation calls for governance clarity
The Ethereum Foundation has published a policy guide, urging governments and institutions to recognize the distinction between decentralized public blockchains like Ethereum and those controlled by corporate entities, as reported by Coindesk. This advocacy highlights the importance of governance structures for government adoption and could influence how regulators and policymakers approach Ethereum in ongoing and future frameworks. Heightened awareness of these governance aspects is contributing to increased engagement from policymakers and underlines the asset's unique status relative to other blockchain projects.
Mixed momentum signals as ETH tests major technical thresholds
On the technical front, ETH/USD remains above the 20-period and 50-period moving averages at $1,590 and $1,594 on the four-hour chart, but stays below the 200-period moving average at $2,288 on the daily timeframe. The Ichimoku Kijun level at $1,597 currently acts as immediate support. Indicator readings are mixed: the Relative Strength Index (RSI) is close to neutral at 52.37 with a Buy signal, the Moving Average Convergence Divergence (MACD) is Neutral, and the Average Directional Index (ADX) indicates a Buy. Meanwhile, the Stochastic RSI suggests a Sell, while the Commodity Channel Index (CCI) and Bull/Bear Power both show buyer dominance. The Awesome Oscillator is also positive and signals upward momentum, though oscillators present divergence and caution.
Breakout risk looms as probabilities tilt toward downside
Over the next four trading days, ETH is expected to trade in a typical volatility band between $1,537 and $1,663. The probability of a move down is slightly greater at 53%, while a 47% chance exists for an upward move. The base scenario anticipates price holding within this horizontal corridor; a bullish breakout above $1,663 would signal upward continuation, while a drop below $1,537 could trigger further declines.
Earlier, analysts noted that Ethereum was exhibiting resilience but remained under sustained bearish pressure amid cautious sentiment. Recent technical improvements and growing policy engagement add a constructive dimension, making the $1,663 resistance a key level for traders to monitor as an upside breakout could indicate a shift toward renewed momentum.


-
 Afghanistan
-
 Albania
-
 Algeria
-
 Angola
-
 Argentina
-
 Armenia
-
 Australia
-
 Austria
-
 Azerbaijan
-
 Bahamas
-
 Bahrain
-
 Bangladesh
-
 Belarus
-
 Belgium
-
 Bolivia
-
 Botswana
-
 Brazil
-
 Brunei
-
 Bulgaria
-
 Cambodia
-
 Cameroon
-
 Canada
-
 Chile
Chile
-
 China
China
-
 Colombia
-
 Congo
Congo
-
 Costa Rica
-
 Cote d'Ivoire
-
 Croatia
-
 Cuba
Cuba
-
 Cyprus
-
 Czechia
-
 DR Congo
-
 Denmark
-
 Dominican Republic
-
 Ecuador
-
 Egypt
Egypt
-
 El Salvador
-
 Estonia
-
 Eswatini
-
 Ethiopia
-
 Finland
-
 France
-
 Georgia
-
 Germany
-
 Ghana
Ghana
-
 Greece
-
 Haiti
Haiti
-
 Hong Kong
-
 Hungary
-
 India
India
-
 Indonesia
-
 Iran, Islamic republic
-
 Iraq
Iraq
-
 Ireland
-
 Israel
-
 Italy
Italy
-
 Jamaica
-
 Japan
Japan
-
 Jordan
-
 Kazakhstan
-
 Kenya
Kenya
-
 Korea
Korea
-
 Kuwait
-
 Kyrgyzstan
-
 Laos
Laos
-
 Latvia
-
 Lebanon
-
 Lesotho
-
 Libya
Libya
-
 Lithuania
-
 Luxembourg
-
 Madagascar
-
 Malaysia
-
 Malta
Malta
-
 Mauritius
-
 Mexico
-
 Moldova
-
 Mongolia
-
 Montenegro
-
 Morocco
-
 Mozambique
-
 Myanmar
-
 Namibia
-
 Nepal
Nepal
-
 Netherlands
-
 New Zealand
-
 Nigeria
-
 North Macedonia
-
 Norway
-
 Oman
Oman
-
 Pakistan
-
 Palestine
-
 Panama
-
 Papua New Guinea
-
 Paraguay
-
 Peru
Peru
-
 Philippines
-
 Poland
-
 Portugal
-
 Puerto Rico
-
 Qatar
Qatar
-
 Reunion
-
 Romania
-
 Rwanda
-
 Saudi Arabia
-
 Serbia
-
 Singapore
-
 Slovakia
-
 Slovenia
-
 Somalia
-
 South Africa
-
 Spain
Spain
-
 Sri Lanka
-
 Sweden
-
 Switzerland
-
 Syria
Syria
-
 Taiwan
-
 Tajikistan
-
 Tanzania
-
 Thailand
-
 Trinidad and Tobago
-
 Tunisia
-
 Turkey
-
 UAE
UAE
-
 Uganda
-
 Ukraine
-
 United Kingdom
-
United States
-
 Uruguay
-
 Uzbekistan
-
 Venezuela
-
 Vietnam
-
 Yemen
Yemen
-
 Zambia
-
 Zimbabwe
- Forex
- Crypto
