

Will Fetch.ai extend gains as price rebound struggles below $0.1514 resistance?

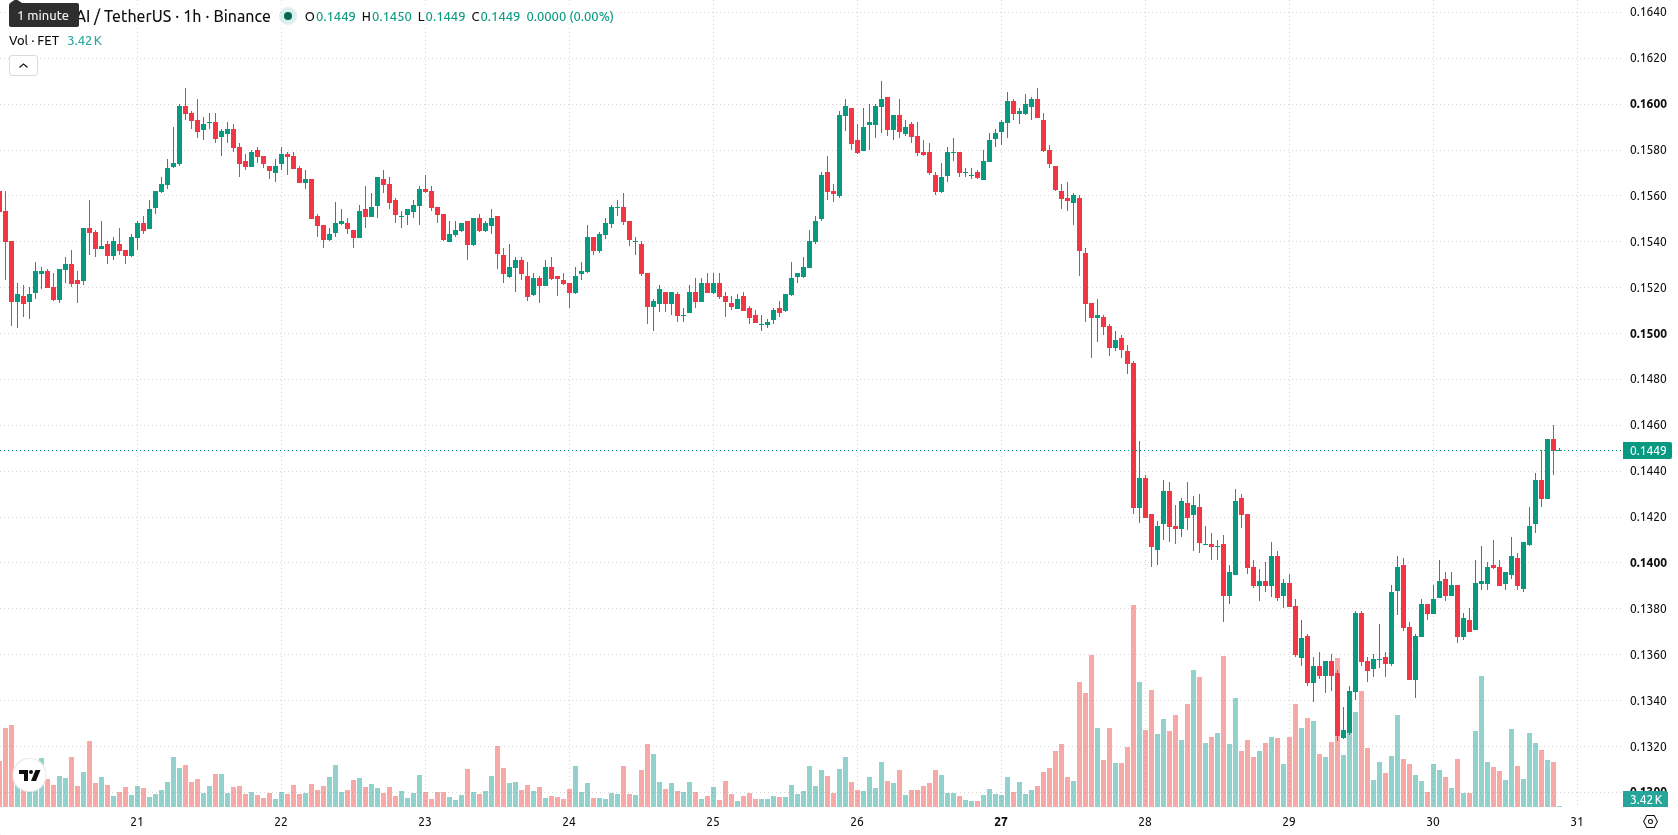
Fetch.ai (FET) is trading at $0.145 after a 7.49% daily gain and currently sits above its key moving averages.
 0.2211
0.2443
0.2211
0.2443
Highlights
- Fetch.ai's market cap has plunged over 96% from its peak, indicating prolonged investor pessimism and eroded fundamental support.
- Sustained declines and high trading activity suggest recent price action is driven by short-term speculation, not institutional accumulation.
- Technical signals show short-term bullish momentum with price expected to trade between $0.1386 and $0.1514 over the next days, but overbought conditions suggest rising downside risk.
Speculative flows dominate as persistent sentiment erosion persists
Fetch.ai has suffered a dramatic contraction in market capitalization, dropping over 96% from its peak, which underscores a prolonged deterioration in investor sentiment and reduced fundamental support for its token. High trading volumes relative to the smaller market cap point to persistent speculative activity, reflecting that current activity is mostly driven by short-term traders rather than institutional buyers. The continued 79% decline over the past year further highlights the token’s ongoing challenges with sentiment and signals that the recent rebound may not be underpinned by sustained strategic accumulation.
Bullish momentum faces exhaustion risks amid stretched overbought signals
On the H1 chart, FET trades above the MA-20 at $0.1398 and MA-50 at $0.1379, while remaining under the long-term MA-200 at $0.1999. The Ichimoku Kijun level at $0.1397 serves as direct support. MACD and ADX both register bullish momentum. RSI clocks in high at 66.8, with Stoch RSI and CCI both well into overbought territory, raising the risk of short-term price exhaustion. Bull/Bear Power readings confirm buyer dominance and align with current high volatility and a 0.0029 price gap. The Awesome Oscillator continues to reinforce the prevailing momentum, though mild divergence emerges with overbought oscillators, suggesting conditions are stretched even as short-term trend strength persists.
Range-bound consolidation likely as upside odds outweigh support risks
Over the next 2–3 trading days, FET is expected to fluctuate within a typical volatility band of $0.1386 to $0.1514. Probabilities favor further upside at 79%, with only a 21% risk of downside breaks. The base case scenario calls for consolidation in this range, while a bullish breakout above resistance could trigger further gains. If the Ichimoku Kijun support at $0.1397 fails, a retracement lower becomes more likely.
Previously it was reported that Fetch.ai faced persistent bearish momentum and pronounced downside risks due to heightened selling pressure and weak sentiment. The current rebound adds a tentative shift in momentum, but with speculative trading still dominant and market cap sharply contracted, traders should closely monitor for sustained consolidation above the Ichimoku Kijun support at $0.1397 as a signal of genuine strength.










-
 Afghanistan
-
 Albania
-
 Algeria
-
 Angola
-
 Argentina
-
 Armenia
-
 Australia
-
 Austria
-
 Azerbaijan
-
 Bahamas
-
 Bahrain
-
 Bangladesh
-
 Belarus
-
 Belgium
-
 Bolivia
-
 Botswana
-
 Brazil
-
 Brunei
-
 Bulgaria
-
 Cambodia
-
 Cameroon
-
 Canada
-
 Chile
Chile
-
 China
China
-
 Colombia
-
 Congo
Congo
-
 Costa Rica
-
 Cote d'Ivoire
-
 Croatia
-
 Cuba
Cuba
-
 Cyprus
-
 Czechia
-
 DR Congo
-
 Denmark
-
 Dominican Republic
-
 Ecuador
-
 Egypt
Egypt
-
 El Salvador
-
 Estonia
-
 Eswatini
-
 Ethiopia
-
 Finland
-
 France
-
 Georgia
-
 Germany
-
 Ghana
Ghana
-
 Greece
-
 Haiti
Haiti
-
 Hong Kong
-
 Hungary
-
 India
India
-
 Indonesia
-
 Iran, Islamic republic
-
 Iraq
Iraq
-
 Ireland
-
 Israel
-
 Italy
Italy
-
 Jamaica
-
 Japan
Japan
-
 Jordan
-
 Kazakhstan
-
 Kenya
Kenya
-
 Korea
Korea
-
 Kuwait
-
 Kyrgyzstan
-
 Laos
Laos
-
 Latvia
-
 Lebanon
-
 Lesotho
-
 Libya
Libya
-
 Lithuania
-
 Luxembourg
-
 Madagascar
-
 Malaysia
-
 Malta
Malta
-
 Mauritius
-
 Mexico
-
 Moldova
-
 Mongolia
-
 Montenegro
-
 Morocco
-
 Mozambique
-
 Myanmar
-
 Namibia
-
 Nepal
Nepal
-
 Netherlands
-
 New Zealand
-
 Nigeria
-
 North Macedonia
-
 Norway
-
 Oman
Oman
-
 Pakistan
-
 Palestine
-
 Panama
-
 Papua New Guinea
-
 Paraguay
-
 Peru
Peru
-
 Philippines
-
 Poland
-
 Portugal
-
 Puerto Rico
-
 Qatar
Qatar
-
 Reunion
-
 Romania
-
 Rwanda
-
 Saudi Arabia
-
 Serbia
-
 Singapore
-
 Slovakia
-
 Slovenia
-
 Somalia
-
 South Africa
-
 Spain
Spain
-
 Sri Lanka
-
 Sweden
-
 Switzerland
-
 Syria
Syria
-
 Taiwan
-
 Tajikistan
-
 Tanzania
-
 Thailand
-
 Trinidad and Tobago
-
 Tunisia
-
 Turkey
-
 UAE
UAE
-
 Uganda
-
 Ukraine
-
 United Kingdom
-
United States
-
 Uruguay
-
 Uzbekistan
-
 Venezuela
-
 Vietnam
-
 Yemen
Yemen
-
 Zambia
-
 Zimbabwe
- Forex
- Crypto












