

The Graph weekly forecast: Range remains tight as price holds near key support

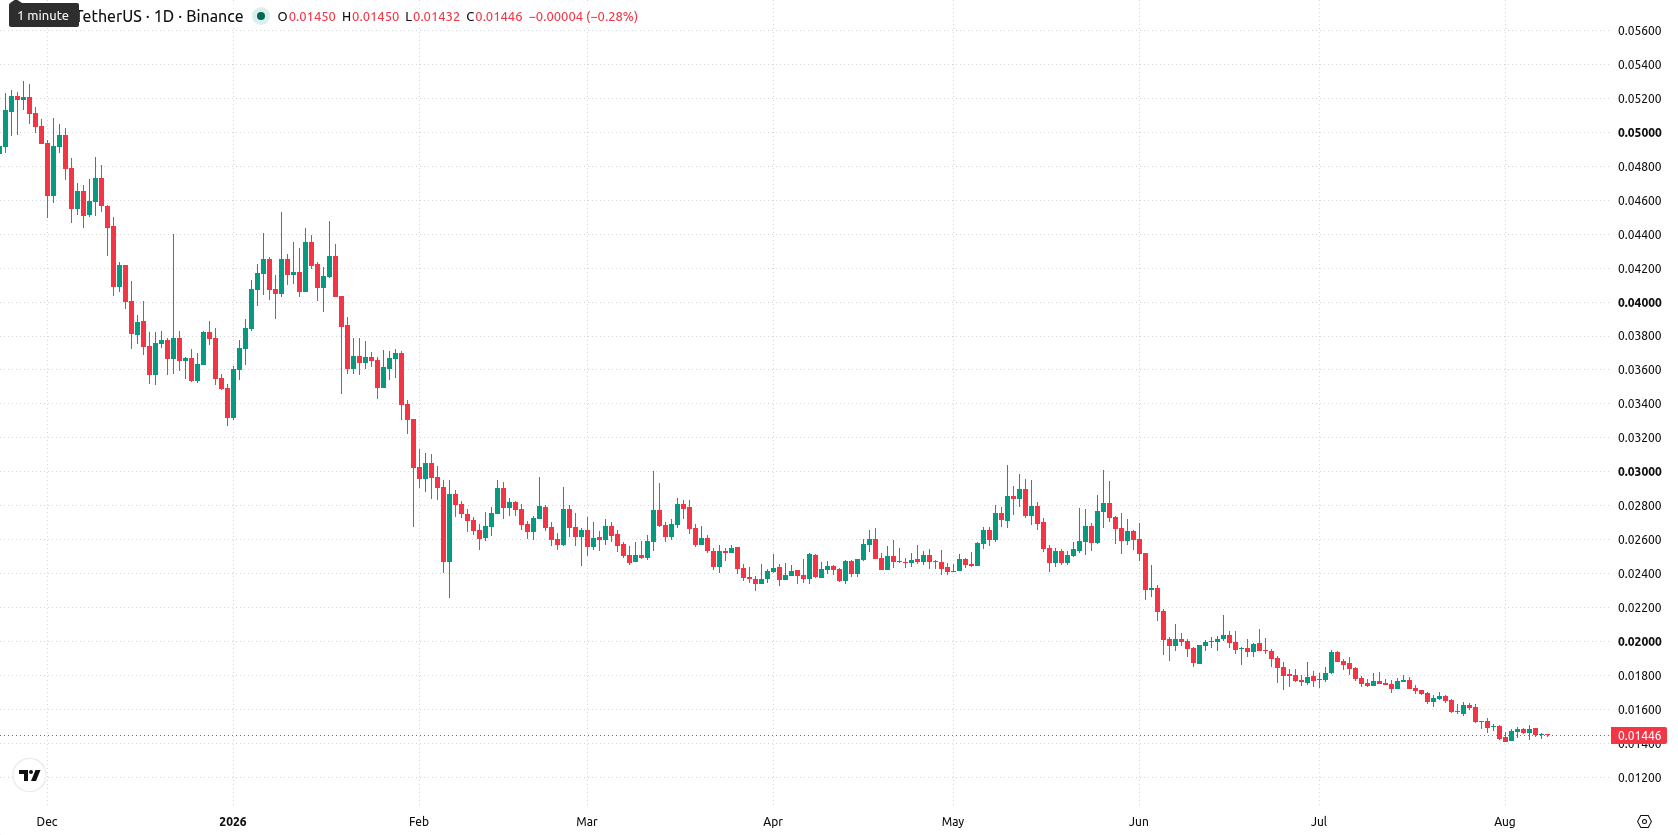
The Graph (GRT) is trading near $0.0145 after gaining just over 1% this week as downside momentum cooled and traders turn their focus to whether support can stabilize the chart. With price action sitting at the lower end of the recent range, market attention now shifts to whether selling pressure can subside or if further losses are likely in the coming week.
 0.01623
0.01898000
Highlights
- The Graph trades below key moving averages, maintaining a bearish long-term outlook despite a 1.05% weekly gain to $0.01445.
- Technical signals are overwhelmingly negative as downside momentum persists, with MACD in sell territory and RSI approaching oversold.
- Price is expected to remain between $0.01395789 and $0.0149421, frequently testing support at $0.01414 with high risk of a further decline if support fails.
Negative technical posture as week’s range narrows near oversold levels
On the daily chart, the structure is negative with price sitting in the lower part of this week's range, showing a sustained move higher with a firm trend but running into resistance from both the moving averages and Ichimoku Kijun at $0.01603. MACD remains firmly in sell territory, while the RSI reading of 32.36 signals the asset is approaching oversold and may be nearing an inflection point. Volatility for the week is measured at 6.58%, suggesting brisk but increasingly directional trading. The nearest support comes in at $0.01414, with resistance at $0.01507; price action remains capped by both threshold levels.
Decreased upside probability as rangebound bias dominates coming week
Over the next 7 days, the expected range is $0.01395789 to $0.0149421, with a very low probability of an increase and a very high probability of a decrease. The base case is continued movement inside this band, with frequent tests of support at $0.01414. A break above resistance at $0.01507 would signal a potential bullish reversal. However, if support at $0.01414 fails, the risk intensifies for a short-term drop toward the lower end of the forecast range.
Earlier, analysts noted that The Graph was entrenched in a bearish trend with persistent downside risk and limited prospects for immediate recovery. The current setup supports this negative outlook, with traders advised to closely monitor the $0.01414 support level as a decisive break could accelerate further declines.











-
 Afghanistan
-
 Albania
-
 Algeria
-
 Angola
-
 Argentina
-
 Armenia
-
 Australia
-
 Austria
-
 Azerbaijan
-
 Bahamas
-
 Bahrain
-
 Bangladesh
-
 Belarus
-
 Belgium
-
 Bolivia
-
 Botswana
-
 Brazil
-
 Brunei
-
 Bulgaria
-
 Cambodia
-
 Cameroon
-
 Canada
-
 Chile
-
 China
-
 Colombia
-
 Congo
-
 Costa Rica
-
 Cote d'Ivoire
-
 Croatia
-
 Cuba
-
 Cyprus
-
 Czechia
-
 DR Congo
-
 Denmark
-
 Dominican Republic
-
 Ecuador
-
 Egypt
-
 El Salvador
-
 Estonia
-
 Eswatini
-
 Ethiopia
-
 Finland
-
 France
-
 Georgia
-
 Germany
-
 Ghana
-
 Greece
-
 Haiti
-
 Hong Kong
-
 Hungary
-
 India
-
 Indonesia
-
 Iran, Islamic republic
-
 Iraq
-
 Ireland
-
 Israel
-
 Italy
-
 Jamaica
-
 Japan
-
 Jordan
-
 Kazakhstan
-
 Kenya
-
 Korea
-
 Kuwait
-
 Kyrgyzstan
-
 Laos
-
 Latvia
-
 Lebanon
-
 Lesotho
-
 Libya
-
 Lithuania
-
 Luxembourg
-
 Madagascar
-
 Malaysia
-
 Malta
-
 Mauritius
-
 Mexico
-
 Moldova
-
 Mongolia
-
 Montenegro
-
 Morocco
-
 Mozambique
-
 Myanmar
-
 Namibia
-
 Nepal
-
 Netherlands
-
 New Zealand
-
 Nigeria
-
 North Macedonia
-
 Norway
-
 Oman
-
 Pakistan
-
 Palestine
-
 Panama
-
 Papua New Guinea
-
 Paraguay
-
 Peru
-
 Philippines
-
 Poland
-
 Portugal
-
 Puerto Rico
-
 Qatar
-
 Reunion
-
 Romania
-
 Rwanda
-
 Saudi Arabia
-
 Serbia
-
 Singapore
-
 Slovakia
-
 Slovenia
-
 Somalia
-
 South Africa
-
 Spain
-
 Sri Lanka
-
 Sweden
-
 Switzerland
-
 Syria
-
 Taiwan
-
 Tajikistan
-
 Tanzania
-
 Thailand
-
 Trinidad and Tobago
-
 Tunisia
-
 Turkey
-
 UAE
-
 Uganda
-
 Ukraine
-
 United Kingdom
-
United States
-
 Uruguay
-
 Uzbekistan
-
 Venezuela
-
 Vietnam
-
 Yemen
-
 Zambia
-
 Zimbabwe
- Forex
- Crypto












