


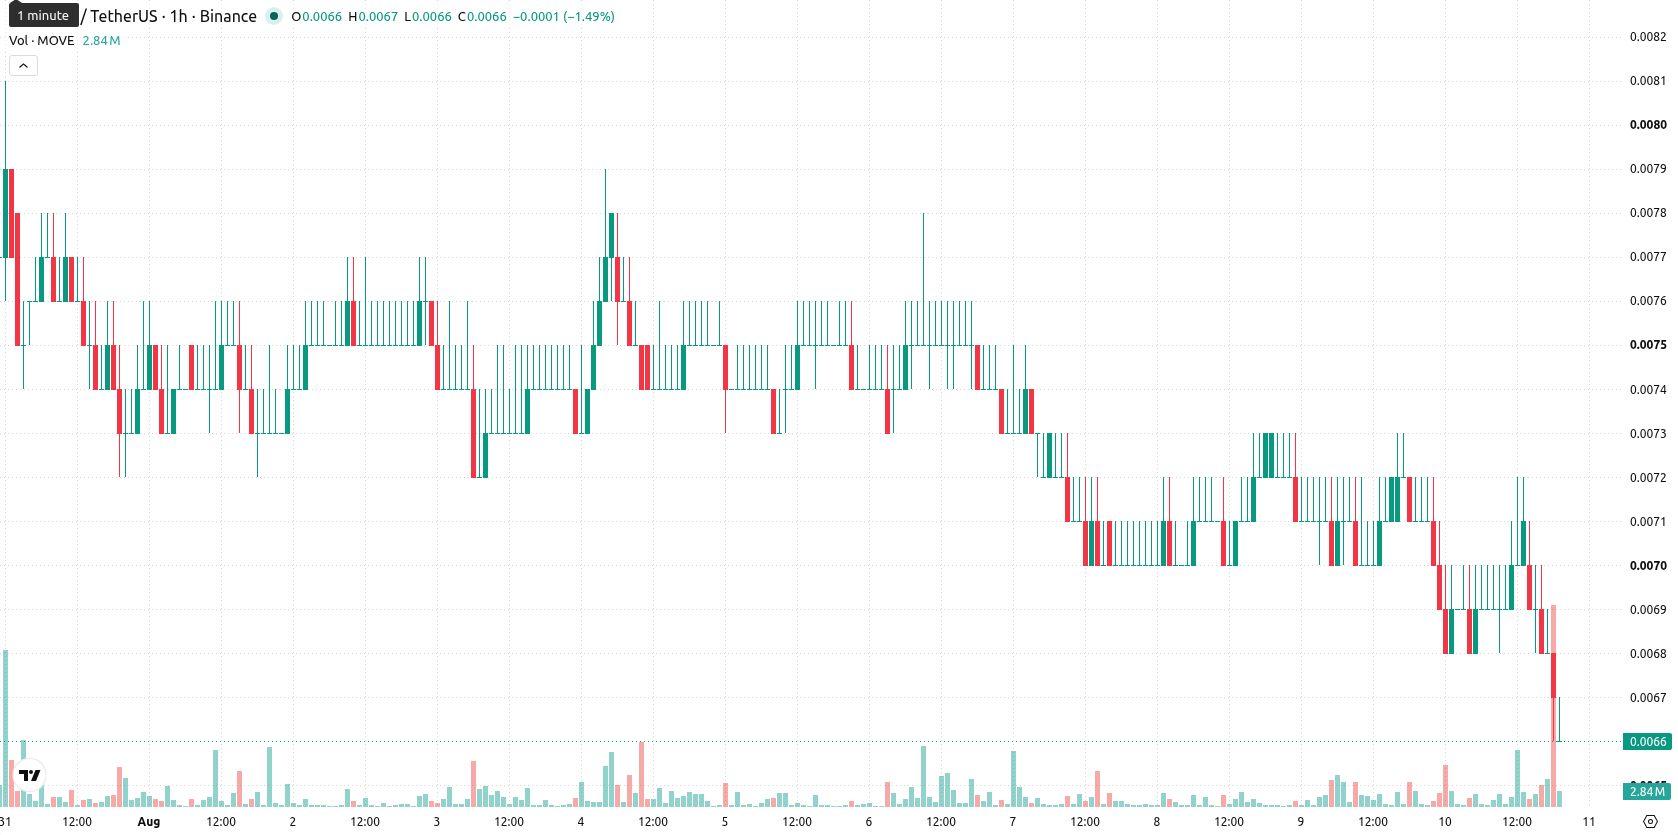
Movement (MOVE) is trading at $0.0066, down 7.04% on the day and sitting below its key moving averages. The price remains under pressure, currently holding near the session low.
 0.0046
0.005068
Highlights
- MOVE/USD continues to face sustained selling pressure, trading decisively below key short- and long-term moving averages.
- Momentum and oscillator indicators remain firmly bearish, with oversold signals confirming strong downside momentum and seller dominance.
- Price is expected to consolidate between $0.0064 and $0.0071 over the next 2 to 3 days, with further downside risk if $0.0064 breaks.
Bearish momentum confirmed as key averages and signals align
On the hourly chart, MOVE/USD trades below the MA-20 at $0.0069 and MA-50 at $0.007, while the daily chart shows a wide gap below the long-term MA-200 at $0.0172. Immediate resistance is marked by the Ichimoku Kijun at $0.007. Momentum signals remain bearish: the MACD and ADX both suggest a sell bias, and the RSI stands at 32.7, confirming negative momentum. Stochastic RSI and CCI indicate oversold conditions, while Bull/Bear Power continues to point to seller control, corroborated by a negative Awesome Oscillator reading and aligned momentum signals.
Limited rebound prospects as prevailing pressure narrows trading range
Over the next 2–3 trading days, MOVE/USD is expected to fluctuate within a range of $0.0064 to $0.0071. The probability of a move higher is rated as very low, while existing downside pressure prevails. The base scenario sees the price consolidating within this corridor; a bullish move would require a break above the $0.007 resistance (Ichimoku Kijun), while a close below $0.0064 would open the way for further weakness.
Earlier, analysts noted that Movement (MOVE) was under sustained bearish pressure, with technical signals supporting the potential for continued downside. The current analysis reinforces this negative outlook, emphasizing the need to monitor the $0.0064 support level for signs of accelerated selling.










-
 Afghanistan
-
 Albania
-
 Algeria
-
 Angola
-
 Argentina
-
 Armenia
-
 Australia
-
 Austria
-
 Azerbaijan
-
 Bahamas
-
 Bahrain
-
 Bangladesh
-
 Belarus
-
 Belgium
-
 Bolivia
-
 Botswana
-
 Brazil
-
 Brunei
-
 Bulgaria
-
 Cambodia
-
 Cameroon
-
 Canada
-
 Chile
-
 China
-
 Colombia
-
 Congo
-
 Costa Rica
-
 Cote d'Ivoire
-
 Croatia
-
 Cuba
-
 Cyprus
-
 Czechia
-
 DR Congo
-
 Denmark
-
 Dominican Republic
-
 Ecuador
-
 Egypt
-
 El Salvador
-
 Estonia
-
 Eswatini
-
 Ethiopia
-
 Finland
-
 France
-
 Georgia
-
 Germany
-
 Ghana
-
 Greece
-
 Haiti
-
 Hong Kong
-
 Hungary
-
 India
-
 Indonesia
-
 Iran, Islamic republic
-
 Iraq
-
 Ireland
-
 Israel
-
 Italy
-
 Jamaica
-
 Japan
-
 Jordan
-
 Kazakhstan
-
 Kenya
-
 Korea
-
 Kuwait
-
 Kyrgyzstan
-
 Laos
-
 Latvia
-
 Lebanon
-
 Lesotho
-
 Libya
-
 Lithuania
-
 Luxembourg
-
 Madagascar
-
 Malaysia
-
 Malta
-
 Mauritius
-
 Mexico
-
 Moldova
-
 Mongolia
-
 Montenegro
-
 Morocco
-
 Mozambique
-
 Myanmar
-
 Namibia
-
 Nepal
-
 Netherlands
-
 New Zealand
-
 Nigeria
-
 North Macedonia
-
 Norway
-
 Oman
-
 Pakistan
-
 Palestine
-
 Panama
-
 Papua New Guinea
-
 Paraguay
-
 Peru
-
 Philippines
-
 Poland
-
 Portugal
-
 Puerto Rico
-
 Qatar
-
 Reunion
-
 Romania
-
 Rwanda
-
 Saudi Arabia
-
 Serbia
-
 Singapore
-
 Slovakia
-
 Slovenia
-
 Somalia
-
 South Africa
-
 Spain
-
 Sri Lanka
-
 Sweden
-
 Switzerland
-
 Syria
-
 Taiwan
-
 Tajikistan
-
 Tanzania
-
 Thailand
-
 Trinidad and Tobago
-
 Tunisia
-
 Turkey
-
 UAE
-
 Uganda
-
 Ukraine
-
 United Kingdom
-
United States
-
 Uruguay
-
 Uzbekistan
-
 Venezuela
-
 Vietnam
-
 Yemen
-
 Zambia
-
 Zimbabwe
- Forex
- Crypto












