

CRV rallies as trading volume tripled monthly average

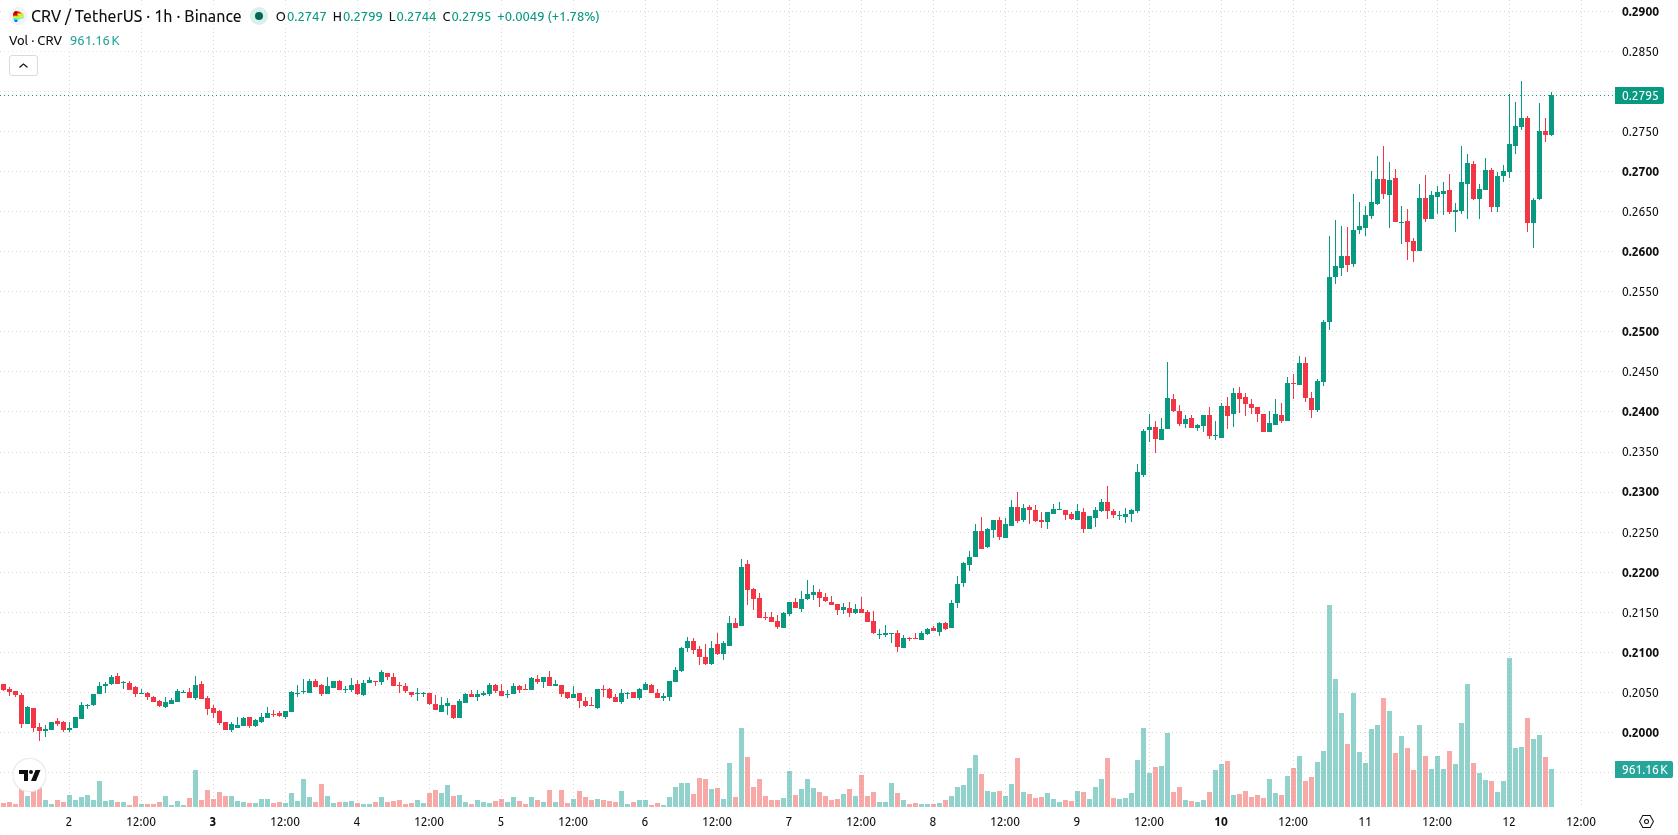
Curve (CRV) is trading at $0.2779 after rising 6.48% on the day, sitting above its key moving averages.
 0.3698
0.3996
0.3698
0.3996
Highlights
- Curve introduced new CRV rewards across three LlamaLend v2 gauges on August 6, directly incentivizing lending on the protocol.
- Trading volumes tripled their monthly average to reach historic highs, signaling active accumulation and broader on-chain participation.
- CRV/USD trades with strong buy momentum and high volatility, with an expected range of $0.2624 to $0.2934 and very high probability of further upside.
Token rewards and volume jump as on-chain activity accelerates
Curve has launched new CRV rewards across three LlamaLend v2 gauges as of August 6, expanding token utility and directly incentivizing lending participation, according to Coinstats. This development delivers a tangible demand catalyst by rewarding ecosystem engagement, spurring broader activity on the protocol. The surge in on-chain activity is further reflected by trading volume tripling its monthly average to reach a historic turnover rate, a signal of active accumulation cited by Diariobitcoin. Additional short-term drivers include active governance proposals covering new markets and borrow limits that may further impact platform economics and sentiment.
Bullish momentum persists as overbought risk emerges on indicators
Technically, CRV/USD trades above the MA-20 and MA-50 on the hourly chart and stands well above the MA-200. The Ichimoku Kijun at $0.27 represents immediate support. Momentum signals are positive: MACD shows strong buy momentum, ADX indicates buyer strength, and Bull/Bear Power confirms intraday buyer dominance. RSI is at 59.5, suggesting a buy bias. However, while Stoch RSI is neutral, CCI points to overbought conditions, and the Awesome Oscillator is neutral, tempering the overall bullish tone with emerging short-term overbought risk.
Sideways bias holds as range-bound trade faces support test
In the short term, CRV/USD is projected to move within the $0.2624–$0.2934 range, which reflects a typical volatility band relative to current levels. There is a very high probability that price consolidates within this corridor, with limited likelihood of a downside break. The baseline scenario anticipates sideways to slightly higher movement barring a break of the immediate Ichimoku Kijun support at $0.27. A move above the upper band could open the way for further upside, while a breach below Kijun would signal a possible shift toward short-term weakness.
Earlier, analysts noted that Curve was displaying short-term bullish momentum but cautioned that overbought conditions could limit further gains. The current report adds that robust protocol incentives and historic trading volumes now reinforce active accumulation, making the Ichimoku Kijun at $0.27 a critical support level to monitor for any shift in trend.








-
 Afghanistan
-
 Albania
-
 Algeria
-
 Angola
-
 Argentina
-
 Armenia
-
 Australia
-
 Austria
-
 Azerbaijan
-
 Bahamas
-
 Bahrain
-
 Bangladesh
-
 Belarus
-
 Belgium
-
 Bolivia
-
 Botswana
-
 Brazil
-
 Brunei
-
 Bulgaria
-
 Cambodia
-
 Cameroon
-
 Canada
-
 Chile
Chile
-
 China
China
-
 Colombia
-
 Congo
Congo
-
 Costa Rica
-
 Cote d'Ivoire
-
 Croatia
-
 Cuba
Cuba
-
 Cyprus
-
 Czechia
-
 DR Congo
-
 Denmark
-
 Dominican Republic
-
 Ecuador
-
 Egypt
Egypt
-
 El Salvador
-
 Estonia
-
 Eswatini
-
 Ethiopia
-
 Finland
-
 France
-
 Georgia
-
 Germany
-
 Ghana
Ghana
-
 Greece
-
 Haiti
Haiti
-
 Hong Kong
-
 Hungary
-
 India
India
-
 Indonesia
-
 Iran, Islamic republic
-
 Iraq
Iraq
-
 Ireland
-
 Israel
-
 Italy
Italy
-
 Jamaica
-
 Japan
Japan
-
 Jordan
-
 Kazakhstan
-
 Kenya
Kenya
-
 Korea
Korea
-
 Kuwait
-
 Kyrgyzstan
-
 Laos
Laos
-
 Latvia
-
 Lebanon
-
 Lesotho
-
 Libya
Libya
-
 Lithuania
-
 Luxembourg
-
 Madagascar
-
 Malaysia
-
 Malta
Malta
-
 Mauritius
-
 Mexico
-
 Moldova
-
 Mongolia
-
 Montenegro
-
 Morocco
-
 Mozambique
-
 Myanmar
-
 Namibia
-
 Nepal
Nepal
-
 Netherlands
-
 New Zealand
-
 Nigeria
-
 North Macedonia
-
 Norway
-
 Oman
Oman
-
 Pakistan
-
 Palestine
-
 Panama
-
 Papua New Guinea
-
 Paraguay
-
 Peru
Peru
-
 Philippines
-
 Poland
-
 Portugal
-
 Puerto Rico
-
 Qatar
Qatar
-
 Reunion
-
 Romania
-
 Rwanda
-
 Saudi Arabia
-
 Serbia
-
 Singapore
-
 Slovakia
-
 Slovenia
-
 Somalia
-
 South Africa
-
 Spain
Spain
-
 Sri Lanka
-
 Sweden
-
 Switzerland
-
 Syria
Syria
-
 Taiwan
-
 Tajikistan
-
 Tanzania
-
 Thailand
-
 Trinidad and Tobago
-
 Tunisia
-
 Turkey
-
 UAE
UAE
-
 Uganda
-
 Ukraine
-
 United Kingdom
-
United States
-
 Uruguay
-
 Uzbekistan
-
 Venezuela
-
 Vietnam
-
 Yemen
Yemen
-
 Zambia
-
 Zimbabwe
- Forex
- Crypto












