

Pyth tests $0.0546 resistance as firm trend support powers move

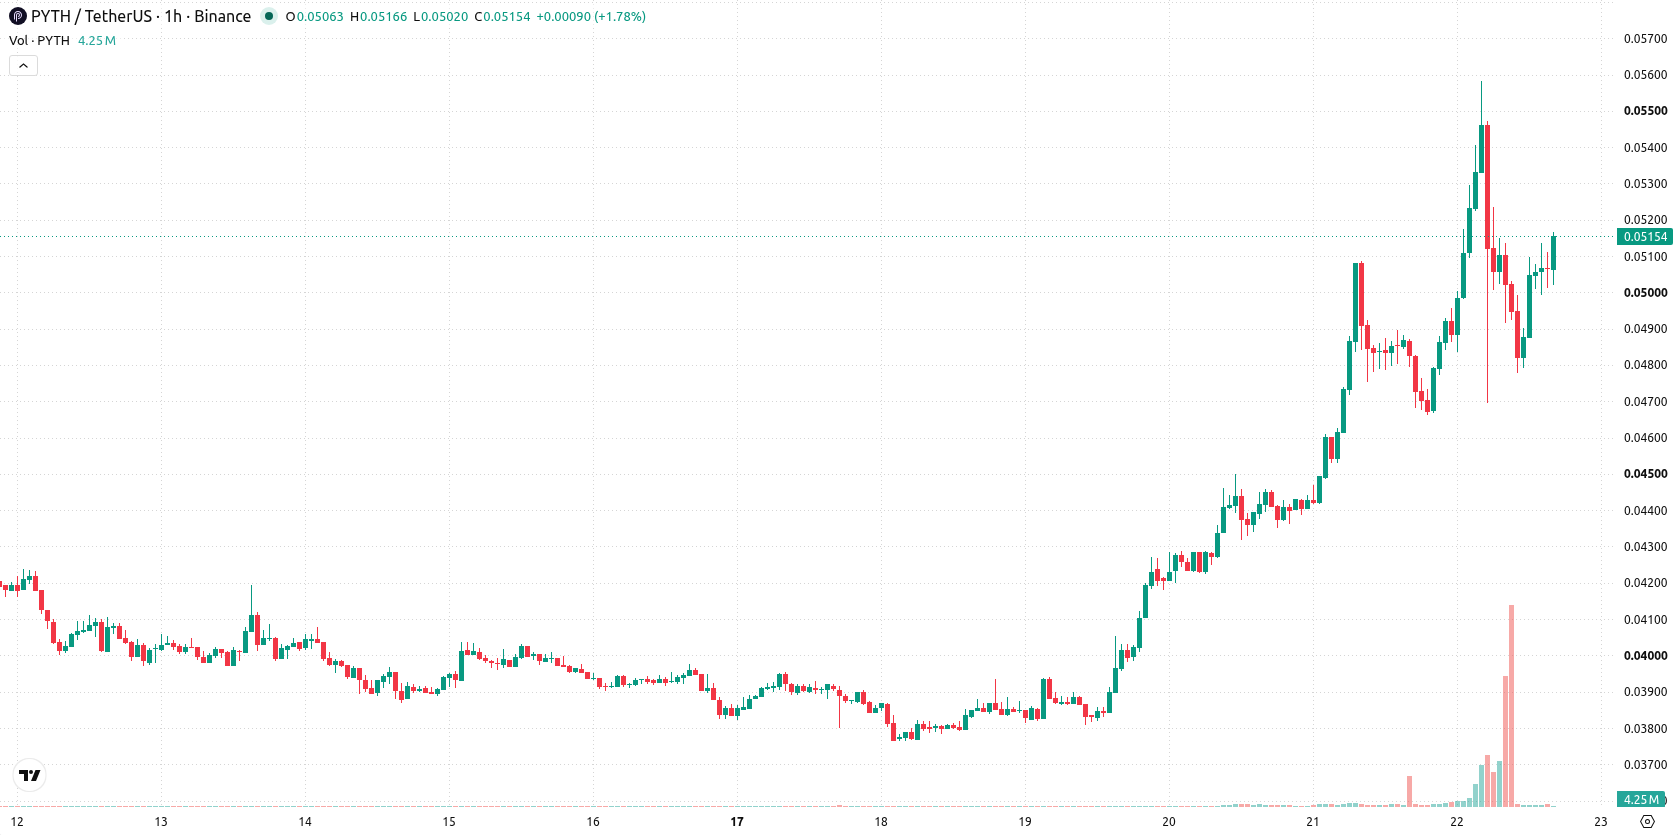
Pyth (PYTH) is trading at $0.0516, climbing 7.17% for the day and posting strong upward momentum. The price is positioned above its key moving averages, indicating firm support from short-, medium-, and longer-term trends.
 0.0908
0.0875
0.0908
0.0875
Highlights
- PYTH/USD is in a strong uptrend across all timeframes, trading well above key moving averages.
- Momentum and directional indicators confirm strong buyer control, but overbought signals are not universally present across all oscillators.
- The expected price range is $0.0486 to $0.0546 over the next 2 to 3 trading days, with $0.0512 as immediate support.
Momentum divergence as price outpaces oscillators near volatility gap
On the technical front, PYTH has broken out above the MA-20 and MA-50 on the hourly chart and is notably trading well above the MA-200 on the daily timeframe. Immediate support is provided by the Ichimoku Kijun at $0.0512. MACD continues to flash strong buy momentum, confirmed by a bullish ADX reading. RSI sits just below 56, skewing bullish but not yet signaling an overbought condition, while Stoch RSI and CCI remain neutral. Bull/Bear Power is firmly tilted in favor of buyers, and Awesome Oscillator backs the prevailing uptrend. The price action displays a gap of 0.0008 with high volatility, and although most momentum and oscillators point to strength, some divergence persists as not all suggest an overbought environment.
Bullish continuation likely as volatility guides short-term consolidation
Looking ahead to the short term, PYTH is likely to consolidate within the $0.0486 to $0.0546 range over the next two to three trading days, corresponding to the current volatility band. The probability of continued upside is high, with price scenarios skewed towards further gains if bullish momentum breaks through resistance levels. If momentum fades, a move back to immediate support or a test of the lower end of the band becomes plausible.
Previously it was reported that Pyth demonstrated strong technical positioning and expanding institutional relevance following the integration of live U.S. Treasury data into its network. The current analysis builds on this outlook, emphasizing that traders should watch for a potential momentum-driven breakout above the upper end of the $0.0546 resistance band as the prevailing upside risk.











-
 Afghanistan
-
 Albania
-
 Algeria
-
 Angola
-
 Argentina
-
 Armenia
-
 Australia
-
 Austria
-
 Azerbaijan
-
 Bahamas
-
 Bahrain
-
 Bangladesh
-
 Belarus
-
 Belgium
-
 Bolivia
-
 Botswana
-
 Brazil
-
 Brunei
-
 Bulgaria
-
 Cambodia
-
 Cameroon
-
 Canada
-
 Chile
Chile
-
 China
China
-
 Colombia
-
 Congo
Congo
-
 Costa Rica
-
 Cote d'Ivoire
-
 Croatia
-
 Cuba
Cuba
-
 Cyprus
-
 Czechia
-
 DR Congo
-
 Denmark
-
 Dominican Republic
-
 Ecuador
-
 Egypt
Egypt
-
 El Salvador
-
 Estonia
-
 Eswatini
-
 Ethiopia
-
 Finland
-
 France
-
 Georgia
-
 Germany
-
 Ghana
Ghana
-
 Greece
-
 Haiti
Haiti
-
 Hong Kong
-
 Hungary
-
 India
India
-
 Indonesia
-
 Iran, Islamic republic
-
 Iraq
Iraq
-
 Ireland
-
 Israel
-
 Italy
Italy
-
 Jamaica
-
 Japan
Japan
-
 Jordan
-
 Kazakhstan
-
 Kenya
Kenya
-
 Korea
Korea
-
 Kuwait
-
 Kyrgyzstan
-
 Laos
Laos
-
 Latvia
-
 Lebanon
-
 Lesotho
-
 Libya
Libya
-
 Lithuania
-
 Luxembourg
-
 Madagascar
-
 Malaysia
-
 Malta
Malta
-
 Mauritius
-
 Mexico
-
 Moldova
-
 Mongolia
-
 Montenegro
-
 Morocco
-
 Mozambique
-
 Myanmar
-
 Namibia
-
 Nepal
Nepal
-
 Netherlands
-
 New Zealand
-
 Nigeria
-
 North Macedonia
-
 Norway
-
 Oman
Oman
-
 Pakistan
-
 Palestine
-
 Panama
-
 Papua New Guinea
-
 Paraguay
-
 Peru
Peru
-
 Philippines
-
 Poland
-
 Portugal
-
 Puerto Rico
-
 Qatar
Qatar
-
 Reunion
-
 Romania
-
 Rwanda
-
 Saudi Arabia
-
 Serbia
-
 Singapore
-
 Slovakia
-
 Slovenia
-
 Somalia
-
 South Africa
-
 Spain
Spain
-
 Sri Lanka
-
 Sweden
-
 Switzerland
-
 Syria
Syria
-
 Taiwan
-
 Tajikistan
-
 Tanzania
-
 Thailand
-
 Trinidad and Tobago
-
 Tunisia
-
 Turkey
-
 UAE
UAE
-
 Uganda
-
 Ukraine
-
 United Kingdom
-
United States
-
 Uruguay
-
 Uzbekistan
-
 Venezuela
-
 Vietnam
-
 Yemen
Yemen
-
 Zambia
-
 Zimbabwe
- Forex
- Crypto












