


The Graph (GRT) is trading at $0.0156, down 8.56% for the session and near its intraday low. The asset is currently positioned below its key moving averages across timeframes, reflecting ongoing negative momentum.
 0.01774
0.01898000
Highlights
- GRT/USD has fallen 8.56% to $0.0156 and is trading below key moving averages across all timeframes.
- Multiple technical indicators, including MACD and ADX, indicate persistent seller dominance and weak momentum despite some short-term oversold signals.
- Expect GRT/USD to consolidate within $0.01443054 to $0.01676946 over the next 2 to 3 days, with declines more likely than a rebound.
Weak momentum and oversold signals reinforce bear control
On the technical front, GRT/USD trades below the MA-20 ($0.0162285), MA-50 ($0.0165402), and MA-200 ($0.022219) on the hourly chart, with the Ichimoku Kijun serving as immediate resistance at $0.01633. Momentum indicators remain weak: both MACD and ADX signal a sell bias, while RSI and CCI are in oversold territory. Stoch RSI is neutral, which points to some exhaustion from recent selling but no clear reversal signal. Bull/Bear Power continues to confirm seller dominance intraday, and the Awesome Oscillator reinforces the prevailing downward direction.
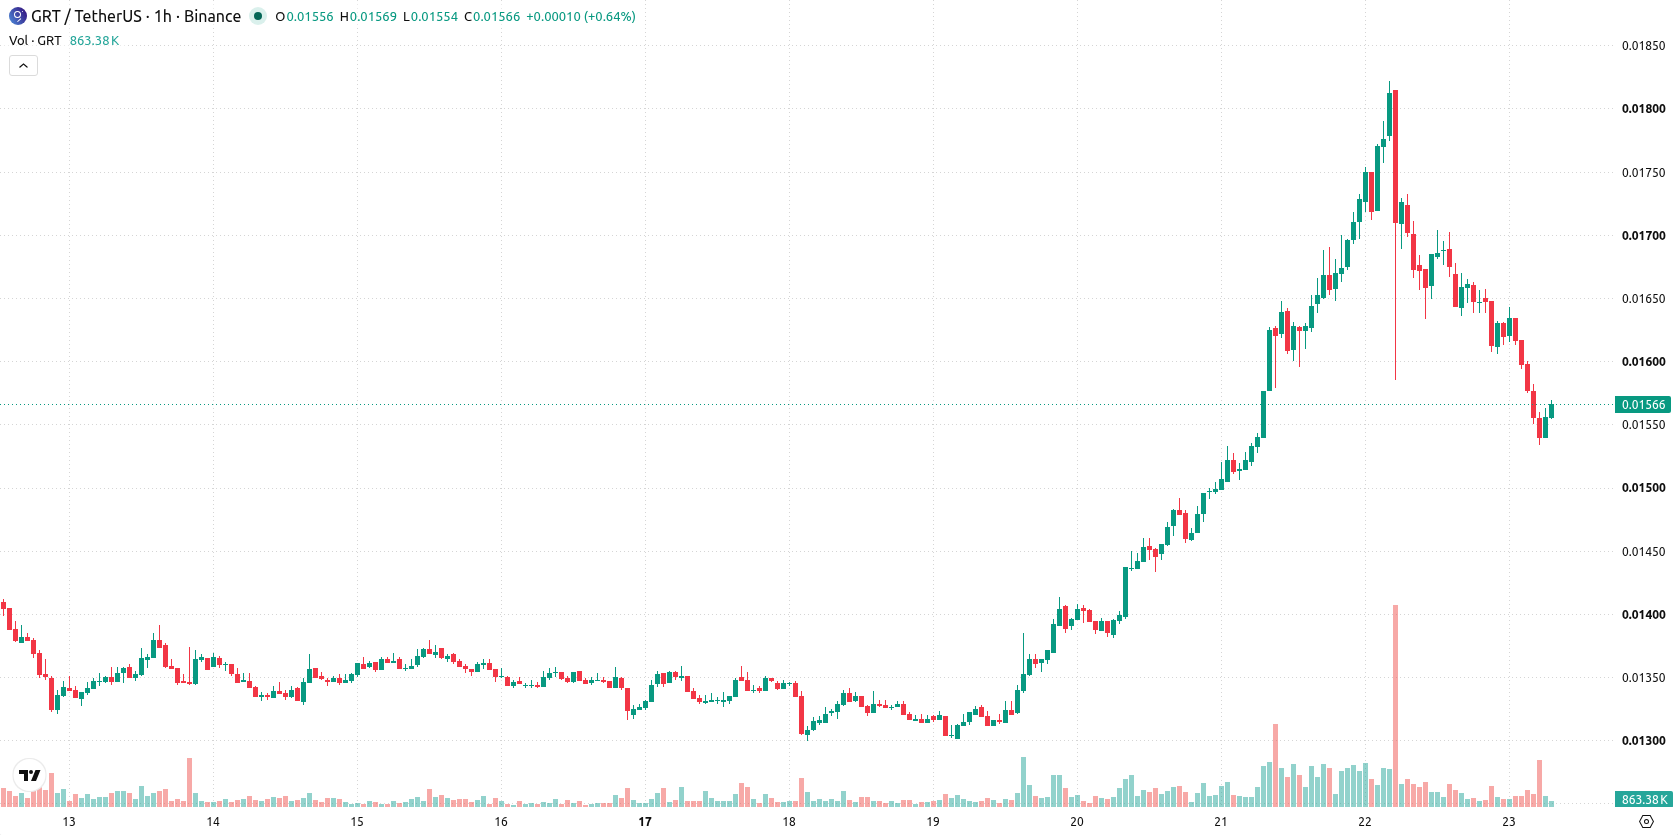
Consolidation expected as downside risk outweighs rebound odds
Over the next two to three trading days, GRT/USD is projected to fluctuate within a volatility band between $0.01443054 and $0.01676946. The baseline scenario is for price to consolidate within this range, as current momentum suggests a higher probability of continued downside and only a 35% chance of an upward move. A break above resistance may prompt a short-term recovery, while a close below the lower boundary risks further price declines.
Earlier, analysts noted that while The Graph was demonstrating persistent bullish momentum, immediate resistance levels posed a key challenge for further advances. The current technical picture marks a shift, with dominant negative momentum and oversold signals increasing downside risk, making the $0.01443054 support a critical level for traders to monitor in the days ahead.











-
 Afghanistan
-
 Albania
-
 Algeria
-
 Angola
-
 Argentina
-
 Armenia
-
 Australia
-
 Austria
-
 Azerbaijan
-
 Bahamas
-
 Bahrain
-
 Bangladesh
-
 Belarus
-
 Belgium
-
 Bolivia
-
 Botswana
-
 Brazil
-
 Brunei
-
 Bulgaria
-
 Cambodia
-
 Cameroon
-
 Canada
-
 Chile
-
 China
-
 Colombia
-
 Congo
-
 Costa Rica
-
 Cote d'Ivoire
-
 Croatia
-
 Cuba
-
 Cyprus
-
 Czechia
-
 DR Congo
-
 Denmark
-
 Dominican Republic
-
 Ecuador
-
 Egypt
-
 El Salvador
-
 Estonia
-
 Eswatini
-
 Ethiopia
-
 Finland
-
 France
-
 Georgia
-
 Germany
-
 Ghana
-
 Greece
-
 Haiti
-
 Hong Kong
-
 Hungary
-
 India
-
 Indonesia
-
 Iran, Islamic republic
-
 Iraq
-
 Ireland
-
 Israel
-
 Italy
-
 Jamaica
-
 Japan
-
 Jordan
-
 Kazakhstan
-
 Kenya
-
 Korea
-
 Kuwait
-
 Kyrgyzstan
-
 Laos
-
 Latvia
-
 Lebanon
-
 Lesotho
-
 Libya
-
 Lithuania
-
 Luxembourg
-
 Madagascar
-
 Malaysia
-
 Malta
-
 Mauritius
-
 Mexico
-
 Moldova
-
 Mongolia
-
 Montenegro
-
 Morocco
-
 Mozambique
-
 Myanmar
-
 Namibia
-
 Nepal
-
 Netherlands
-
 New Zealand
-
 Nigeria
-
 North Macedonia
-
 Norway
-
 Oman
-
 Pakistan
-
 Palestine
-
 Panama
-
 Papua New Guinea
-
 Paraguay
-
 Peru
-
 Philippines
-
 Poland
-
 Portugal
-
 Puerto Rico
-
 Qatar
-
 Reunion
-
 Romania
-
 Rwanda
-
 Saudi Arabia
-
 Serbia
-
 Singapore
-
 Slovakia
-
 Slovenia
-
 Somalia
-
 South Africa
-
 Spain
-
 Sri Lanka
-
 Sweden
-
 Switzerland
-
 Syria
-
 Taiwan
-
 Tajikistan
-
 Tanzania
-
 Thailand
-
 Trinidad and Tobago
-
 Tunisia
-
 Turkey
-
 UAE
-
 Uganda
-
 Ukraine
-
 United Kingdom
-
United States
-
 Uruguay
-
 Uzbekistan
-
 Venezuela
-
 Vietnam
-
 Yemen
-
 Zambia
-
 Zimbabwe
- Forex
- Crypto












