

Optimism faces resistance at $0.1021 with consolidation between key levels: weekly analysis

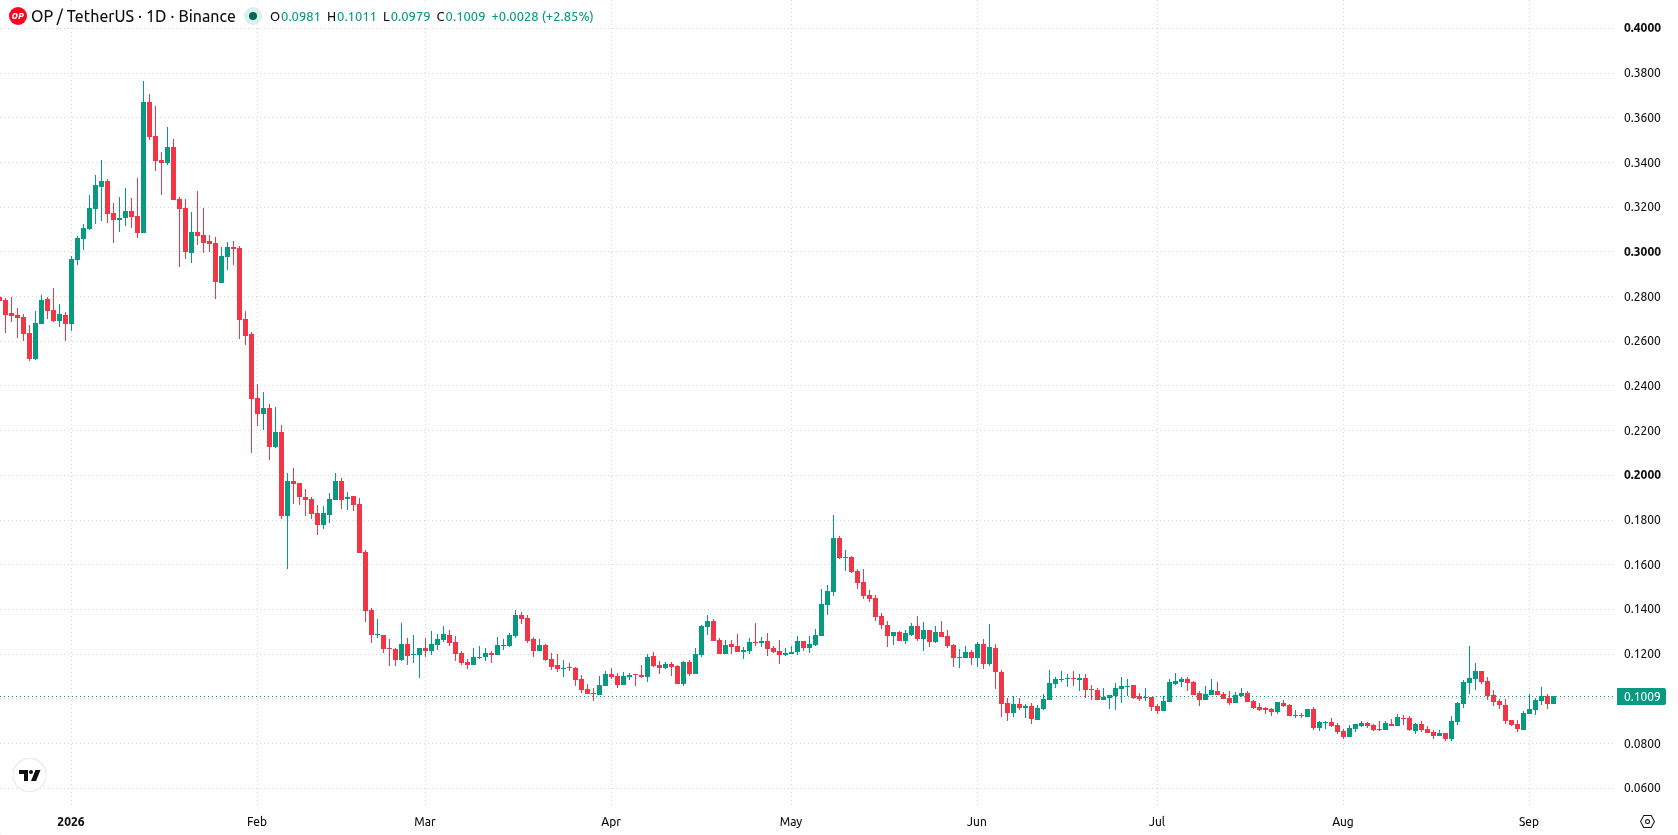
Optimism (OP) is trading near $0.10 after gaining more than 12% over the last week, as the technical picture reveals a tug-of-war between conflicting signals on the chart. Positive momentum clashes with a mixed trend outlook, bringing key support levels into focus as traders weigh their next moves for the week ahead.
 0.146
0.1476
0.146
0.1476
Highlights
- Optimism gained 12.37% over the past 7 days to $0.1009, showing short-term buying strength.
- Mixed technical indicators reveal strong buyer pressure and choppy momentum, with both bullish and bearish signals present.
- The expected weekly range is $0.0901 to $0.1116, with key support at $0.0962 and resistance at $0.1021.
Ecosystem growth and superchain upgrade drive momentum as defi activity rises
Optimism reported significant growth in DeFi activity and stablecoins within its ecosystem last week, according to Coinfomania, reflecting increased on-chain engagement that may influence sentiment moving forward. Developers now have access to Optimism's Superchain interoperability upgrade on the Sepolia testnet, as detailed by Bitcoinist, expanding testing for cross-OP Stack chain messaging. CryptoSlate noted network speed improvements on OP Mainnet, though the changes present new considerations for data consumers, while The Cerbat Gem reported ongoing strong trading volumes and shifting market capitalization.
Diverging signals and volatile action as MACD strength contradicts moving average
On the daily chart, momentum shows a sharp move higher without a sustained trend, with volatility at 24.06%. Bull/Bear Power indicates strong buyer dominance, while the MACD is in buy territory, but the HMA supports a sell view—together, these reflect a clear divergence in signals. The nearest support is at $0.0962, with the Ichimoku Kijun acting as resistance at $0.1021. This setup suggests price action will be confrontational at these levels, with mixed momentum likely keeping moves choppy.
Consolidation bias holds as breakout chances hinge on key resistance
Over the coming week, the expected range is $0.0901 to $0.1116, with a 68% probability of an increase and a 32% chance of a decrease. The base case is further consolidation between $0.0962 support and $0.1021 resistance. A sustained close above $0.1021 opens up the upper end of the range, while a drop below $0.0962 would bring $0.0901 into focus as the next downside target.
Earlier, analysts noted that Optimism was demonstrating near-term resilience despite conflicting technical signals and pressure from long-term resistance. The current analysis adds that ongoing growth in DeFi activity and new interoperability upgrades are expanding engagement across the ecosystem, making it crucial for traders to monitor a sustained close above $0.1021 as the next key trigger for potential upside movement.










-
 Afghanistan
-
 Albania
-
 Algeria
-
 Angola
-
 Argentina
-
 Armenia
-
 Australia
-
 Austria
-
 Azerbaijan
-
 Bahamas
-
 Bahrain
-
 Bangladesh
-
 Belarus
-
 Belgium
-
 Bolivia
-
 Botswana
-
 Brazil
-
 Brunei
-
 Bulgaria
-
 Cambodia
-
 Cameroon
-
 Canada
-
 Chile
Chile
-
 China
China
-
 Colombia
-
 Congo
Congo
-
 Costa Rica
-
 Cote d'Ivoire
-
 Croatia
-
 Cuba
Cuba
-
 Cyprus
-
 Czechia
-
 DR Congo
-
 Denmark
-
 Dominican Republic
-
 Ecuador
-
 Egypt
Egypt
-
 El Salvador
-
 Estonia
-
 Eswatini
-
 Ethiopia
-
 Finland
-
 France
-
 Georgia
-
 Germany
-
 Ghana
Ghana
-
 Greece
-
 Haiti
Haiti
-
 Hong Kong
-
 Hungary
-
 India
India
-
 Indonesia
-
 Iran, Islamic republic
-
 Iraq
Iraq
-
 Ireland
-
 Israel
-
 Italy
Italy
-
 Jamaica
-
 Japan
Japan
-
 Jordan
-
 Kazakhstan
-
 Kenya
Kenya
-
 Korea
Korea
-
 Kuwait
-
 Kyrgyzstan
-
 Laos
Laos
-
 Latvia
-
 Lebanon
-
 Lesotho
-
 Libya
Libya
-
 Lithuania
-
 Luxembourg
-
 Madagascar
-
 Malaysia
-
 Malta
Malta
-
 Mauritius
-
 Mexico
-
 Moldova
-
 Mongolia
-
 Montenegro
-
 Morocco
-
 Mozambique
-
 Myanmar
-
 Namibia
-
 Nepal
Nepal
-
 Netherlands
-
 New Zealand
-
 Nigeria
-
 North Macedonia
-
 Norway
-
 Oman
Oman
-
 Pakistan
-
 Palestine
-
 Panama
-
 Papua New Guinea
-
 Paraguay
-
 Peru
Peru
-
 Philippines
-
 Poland
-
 Portugal
-
 Puerto Rico
-
 Qatar
Qatar
-
 Reunion
-
 Romania
-
 Rwanda
-
 Saudi Arabia
-
 Serbia
-
 Singapore
-
 Slovakia
-
 Slovenia
-
 Somalia
-
 South Africa
-
 Spain
Spain
-
 Sri Lanka
-
 Sweden
-
 Switzerland
-
 Syria
Syria
-
 Taiwan
-
 Tajikistan
-
 Tanzania
-
 Thailand
-
 Trinidad and Tobago
-
 Tunisia
-
 Turkey
-
 UAE
UAE
-
 Uganda
-
 Ukraine
-
 United Kingdom
-
United States
-
 Uruguay
-
 Uzbekistan
-
 Venezuela
-
 Vietnam
-
 Yemen
Yemen
-
 Zambia
-
 Zimbabwe
- Forex
- Crypto












