

Plasma support test at $0.0816: Technical outlook

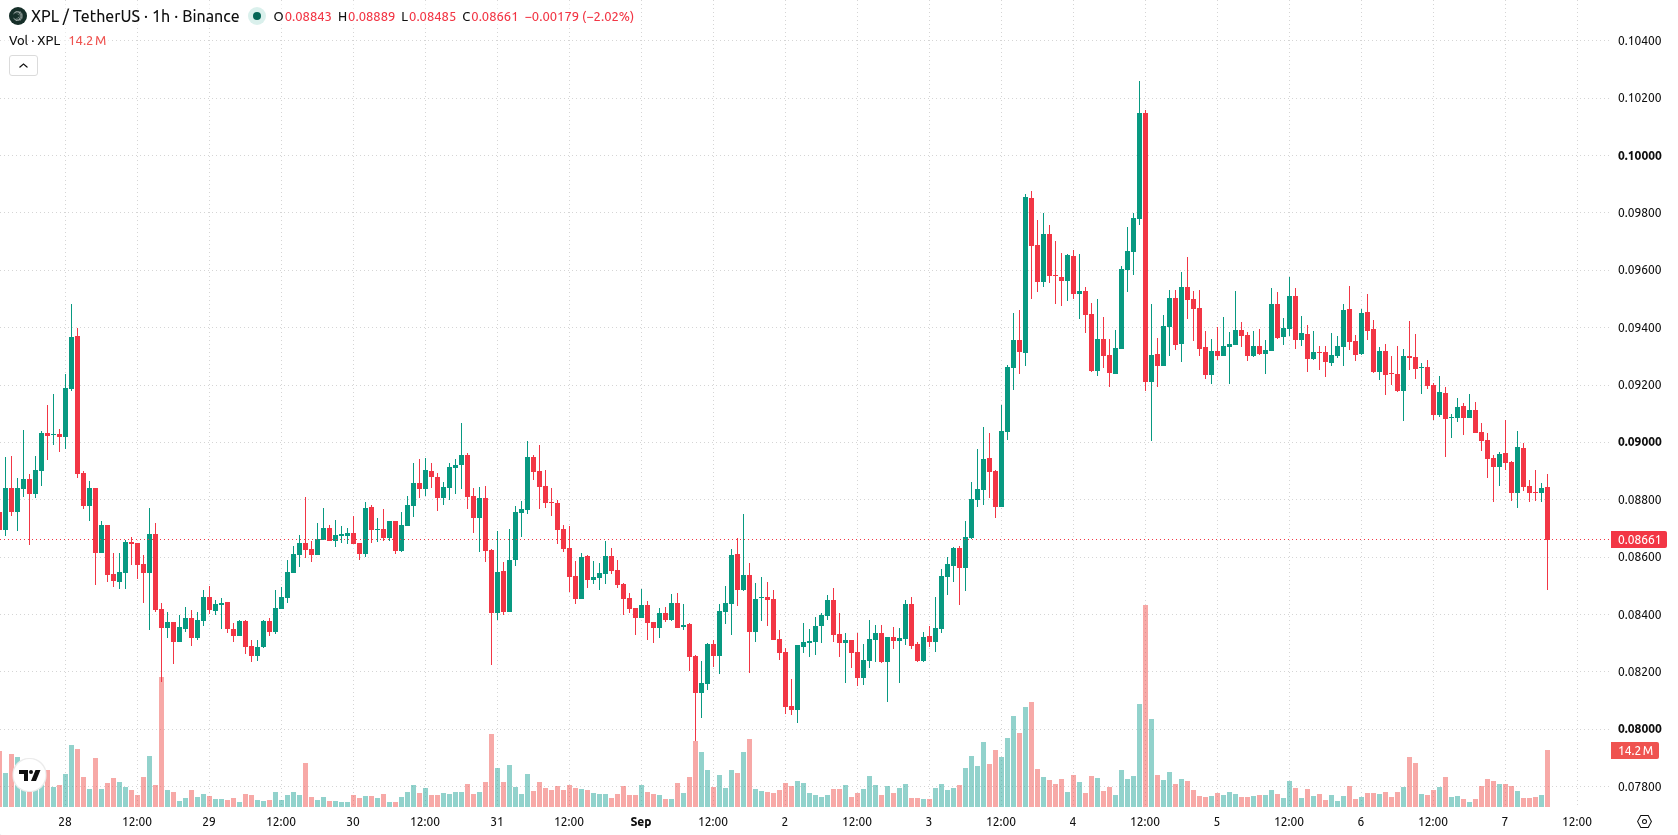
Plasma (XPL) is trading at $0.0867, extending its downward move with a 6.77% decline on the day. The asset is currently positioned below its key moving averages.
 0.0808
0.0908
0.0808
0.0908
Highlights
- Plasma introduced Plasma One, enabling users to spend stablecoins globally via Visa and earn up to 6% APY in XPL rewards.
- The app features cashback on eligible AI subscription purchases and referral bonuses aimed at strengthening user engagement within the ecosystem.
- XPL/USD remains under broad selling pressure with a projected range of $0.0816 to $0.0918 for the next 2 to 3 days, and technical indicators confirm a dominant bearish trend with low probability of reversal.
User incentives rise as new app launch fails to lift sentiment
Plasma's recent launch of Plasma One, its proprietary app that enables users to spend stablecoins worldwide through a Visa card while earning up to 6% APY in XPL rewards, marks a notable product advancement. This initiative enhances the utility and appeal of the Plasma ecosystem by providing tangible rewards, cashback on eligible AI subscription purchases, and structured referral bonuses to encourage adoption. Although these features support long-term engagement and transaction activity within Plasma’s user base, price action has remained under broader selling pressure.
Bearish barriers persist as weak momentum meets oversold signals
On the technical front, XPL/USD is trading below the MA-20 at $0.0899 and MA-50 at $0.092 on the H1 chart, and remains under the MA-200 at $0.0941 on the daily horizon. The Ichimoku Kijun level at $0.091 acts as immediate resistance, capping upward attempts. Momentum indicators are weak: MACD signals Sell, ADX is Neutral, while RSI also points to Sell. CCI indicates Oversold conditions, with Stoch RSI showing a Buy and Bull/Bear Power confirming seller dominance. The Awesome Oscillator is Neutral, and divergence is present as Stoch RSI is positive against the prevailing bearish momentum. Intraday, XPL is trading near its daily low after a session marked by high volatility and a negative gap of $0.0033.
Sideways action favored as breakout risks skew to the downside
Over the next 2–3 trading days, XPL/USD is expected to fluctuate between $0.0816 and $0.0918, a volatility band relative to current levels. The probability of a move higher remains very low, with the likelihood of further downside classified as very high. The baseline expectation is for XPL/USD to trade sideways within this corridor, barring a break above the $0.091 resistance or a drop below the $0.0816 support, which would establish new momentum in either direction.
Earlier, analysts noted that Plasma was experiencing a period of indecision, with a sideways trading scenario prevailing amid persistent volatility. The latest price action and technical signals reinforce this cautious outlook, with traders now advised to monitor for any sustained move beyond the $0.091 resistance or below the $0.0816 support, as these levels could trigger a decisive break in the current range.










-
 Afghanistan
-
 Albania
-
 Algeria
-
 Angola
-
 Argentina
-
 Armenia
-
 Australia
-
 Austria
-
 Azerbaijan
-
 Bahamas
-
 Bahrain
-
 Bangladesh
-
 Belarus
-
 Belgium
-
 Bolivia
-
 Botswana
-
 Brazil
-
 Brunei
-
 Bulgaria
-
 Cambodia
-
 Cameroon
-
 Canada
-
 Chile
Chile
-
 China
China
-
 Colombia
-
 Congo
Congo
-
 Costa Rica
-
 Cote d'Ivoire
-
 Croatia
-
 Cuba
Cuba
-
 Cyprus
-
 Czechia
-
 DR Congo
-
 Denmark
-
 Dominican Republic
-
 Ecuador
-
 Egypt
Egypt
-
 El Salvador
-
 Estonia
-
 Eswatini
-
 Ethiopia
-
 Finland
-
 France
-
 Georgia
-
 Germany
-
 Ghana
Ghana
-
 Greece
-
 Haiti
Haiti
-
 Hong Kong
-
 Hungary
-
 India
India
-
 Indonesia
-
 Iran, Islamic republic
-
 Iraq
Iraq
-
 Ireland
-
 Israel
-
 Italy
Italy
-
 Jamaica
-
 Japan
Japan
-
 Jordan
-
 Kazakhstan
-
 Kenya
Kenya
-
 Korea
Korea
-
 Kuwait
-
 Kyrgyzstan
-
 Laos
Laos
-
 Latvia
-
 Lebanon
-
 Lesotho
-
 Libya
Libya
-
 Lithuania
-
 Luxembourg
-
 Madagascar
-
 Malaysia
-
 Malta
Malta
-
 Mauritius
-
 Mexico
-
 Moldova
-
 Mongolia
-
 Montenegro
-
 Morocco
-
 Mozambique
-
 Myanmar
-
 Namibia
-
 Nepal
Nepal
-
 Netherlands
-
 New Zealand
-
 Nigeria
-
 North Macedonia
-
 Norway
-
 Oman
Oman
-
 Pakistan
-
 Palestine
-
 Panama
-
 Papua New Guinea
-
 Paraguay
-
 Peru
Peru
-
 Philippines
-
 Poland
-
 Portugal
-
 Puerto Rico
-
 Qatar
Qatar
-
 Reunion
-
 Romania
-
 Rwanda
-
 Saudi Arabia
-
 Serbia
-
 Singapore
-
 Slovakia
-
 Slovenia
-
 Somalia
-
 South Africa
-
 Spain
Spain
-
 Sri Lanka
-
 Sweden
-
 Switzerland
-
 Syria
Syria
-
 Taiwan
-
 Tajikistan
-
 Tanzania
-
 Thailand
-
 Trinidad and Tobago
-
 Tunisia
-
 Turkey
-
 UAE
UAE
-
 Uganda
-
 Ukraine
-
 United Kingdom
-
United States
-
 Uruguay
-
 Uzbekistan
-
 Venezuela
-
 Vietnam
-
 Yemen
Yemen
-
 Zambia
-
 Zimbabwe
- Forex
- Crypto












