


Jito (JTO) dropped 10.22% as sustained bearish momentum and ongoing downside technical pressure dominated trading. This move is supported by the asset’s position below its key moving averages and the lack of any new fundamental catalyst.
 0.5409
0.5856
0.5409
0.5856
Highlights
- Jito is under persistent downside pressure, trading below key moving averages and closing near session lows after a 10.22% drop.
- Short-term indicators are mixed, with weak momentum and some overbought signals, limiting the scope for immediate recovery.
- Expected price range for the next five sessions is $0.3626 to $0.4558, with over 80% probability of further downside.
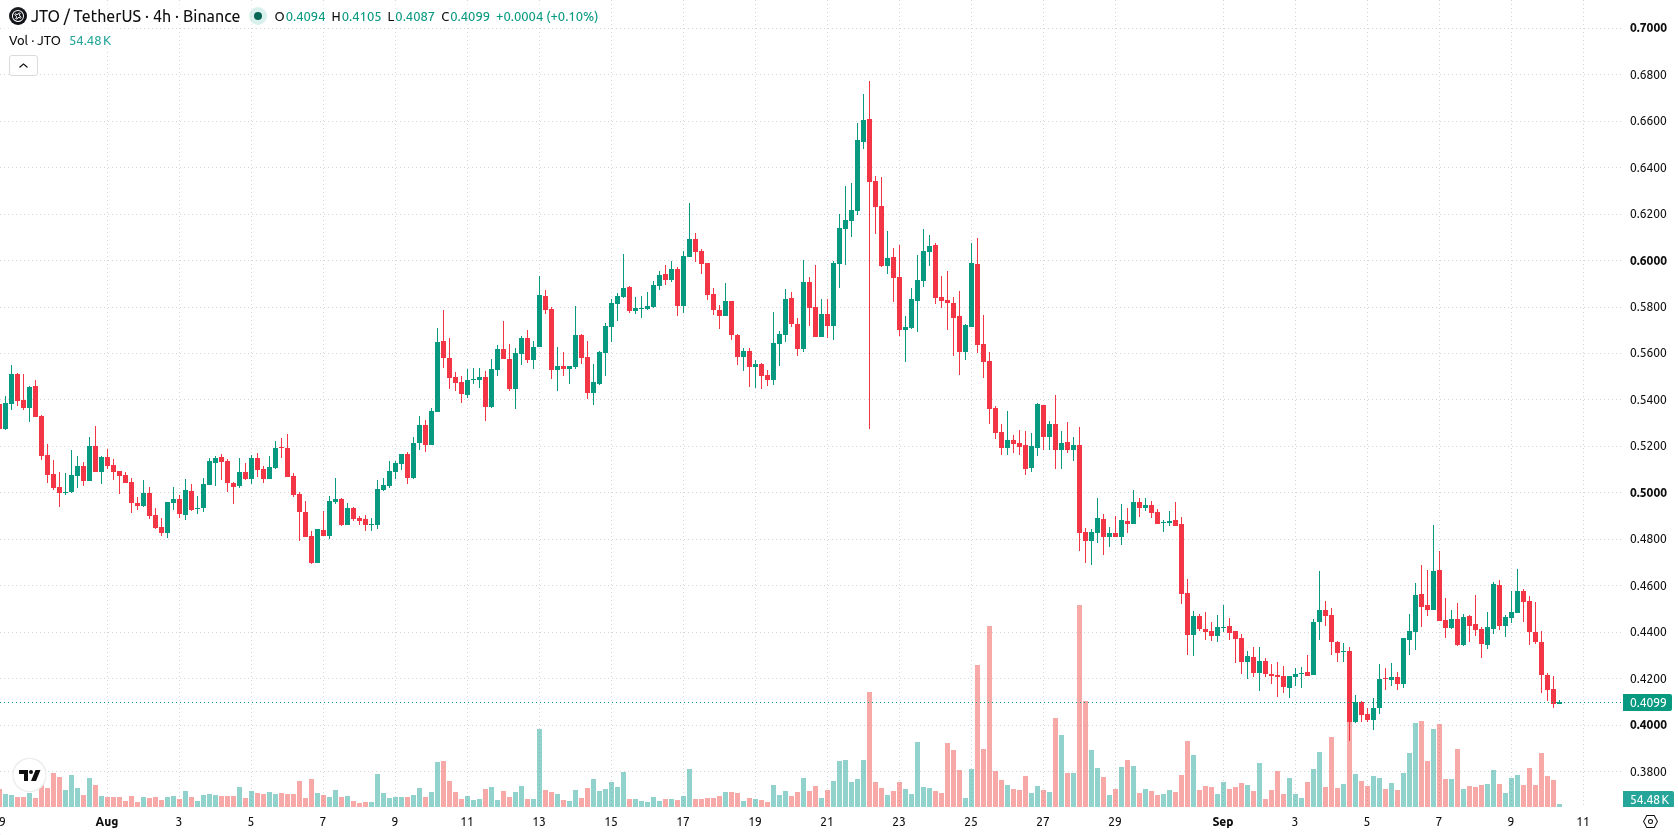
Sustained technical weakness as support tests clash with long-term bullish setup
Jito is trading below the 20-day ($0.4897), 50-day ($0.5255), and 200-day ($0.4734) moving averages, indicating persistent short-, medium-, and long-term downside pressure. The near-term ceiling stands at $0.4103, with a near-term floor at $0.3928. The prevailing trend is confirmed as bearish given the substantial distance to overhead resistance levels, even as a bullish long-term MA-50 vs MA-200 alignment contrasts the short-term weakness. Momentum readings remain weak, with the MACD indicating a 'Strong Sell' signal and the Average Directional Index (ADX) registering as Neutral, pointing to downside risk but limited conviction. The Relative Strength Index (RSI) is at 42.81 ('Sell'), while the Stochastic RSI is showing 'Overbought' conditions and the Commodity Channel Index (CCI) is at Neutral, leading to conflicting short-term signals. Bull/Bear Power (BBP) is slightly positive at 0.0083, suggesting minor intraday buyer dominance. However, price action is near session lows with a 7.55% downside gap and intraday volatility at 2.92%, reflecting ongoing pressure as downside momentum and short-term oscillators diverge.
Earlier, analysts noted that Jito was showing signs of consolidation with a potential for an upside breakout amid mixed technical signals. The latest data confirms a decisive shift to sustained bearish momentum, making the $0.3928 support a crucial level to monitor for signs of further downside risk.










-
 Afghanistan
-
 Albania
-
 Algeria
-
 Angola
-
 Argentina
-
 Armenia
-
 Australia
-
 Austria
-
 Azerbaijan
-
 Bahamas
-
 Bahrain
-
 Bangladesh
-
 Belarus
-
 Belgium
-
 Bolivia
-
 Botswana
-
 Brazil
-
 Brunei
-
 Bulgaria
-
 Cambodia
-
 Cameroon
-
 Canada
-
 Chile
Chile
-
 China
China
-
 Colombia
-
 Congo
Congo
-
 Costa Rica
-
 Cote d'Ivoire
-
 Croatia
-
 Cuba
Cuba
-
 Cyprus
-
 Czechia
-
 DR Congo
-
 Denmark
-
 Dominican Republic
-
 Ecuador
-
 Egypt
Egypt
-
 El Salvador
-
 Estonia
-
 Eswatini
-
 Ethiopia
-
 Finland
-
 France
-
 Georgia
-
 Germany
-
 Ghana
Ghana
-
 Greece
-
 Haiti
Haiti
-
 Hong Kong
-
 Hungary
-
 India
India
-
 Indonesia
-
 Iran, Islamic republic
-
 Iraq
Iraq
-
 Ireland
-
 Israel
-
 Italy
Italy
-
 Jamaica
-
 Japan
Japan
-
 Jordan
-
 Kazakhstan
-
 Kenya
Kenya
-
 Korea
Korea
-
 Kuwait
-
 Kyrgyzstan
-
 Laos
Laos
-
 Latvia
-
 Lebanon
-
 Lesotho
-
 Libya
Libya
-
 Lithuania
-
 Luxembourg
-
 Madagascar
-
 Malaysia
-
 Malta
Malta
-
 Mauritius
-
 Mexico
-
 Moldova
-
 Mongolia
-
 Montenegro
-
 Morocco
-
 Mozambique
-
 Myanmar
-
 Namibia
-
 Nepal
Nepal
-
 Netherlands
-
 New Zealand
-
 Nigeria
-
 North Macedonia
-
 Norway
-
 Oman
Oman
-
 Pakistan
-
 Palestine
-
 Panama
-
 Papua New Guinea
-
 Paraguay
-
 Peru
Peru
-
 Philippines
-
 Poland
-
 Portugal
-
 Puerto Rico
-
 Qatar
Qatar
-
 Reunion
-
 Romania
-
 Rwanda
-
 Saudi Arabia
-
 Serbia
-
 Singapore
-
 Slovakia
-
 Slovenia
-
 Somalia
-
 South Africa
-
 Spain
Spain
-
 Sri Lanka
-
 Sweden
-
 Switzerland
-
 Syria
Syria
-
 Taiwan
-
 Tajikistan
-
 Tanzania
-
 Thailand
-
 Trinidad and Tobago
-
 Tunisia
-
 Turkey
-
 UAE
UAE
-
 Uganda
-
 Ukraine
-
 United Kingdom
-
United States
-
 Uruguay
-
 Uzbekistan
-
 Venezuela
-
 Vietnam
-
 Yemen
Yemen
-
 Zambia
-
 Zimbabwe
- Forex
- Crypto












