


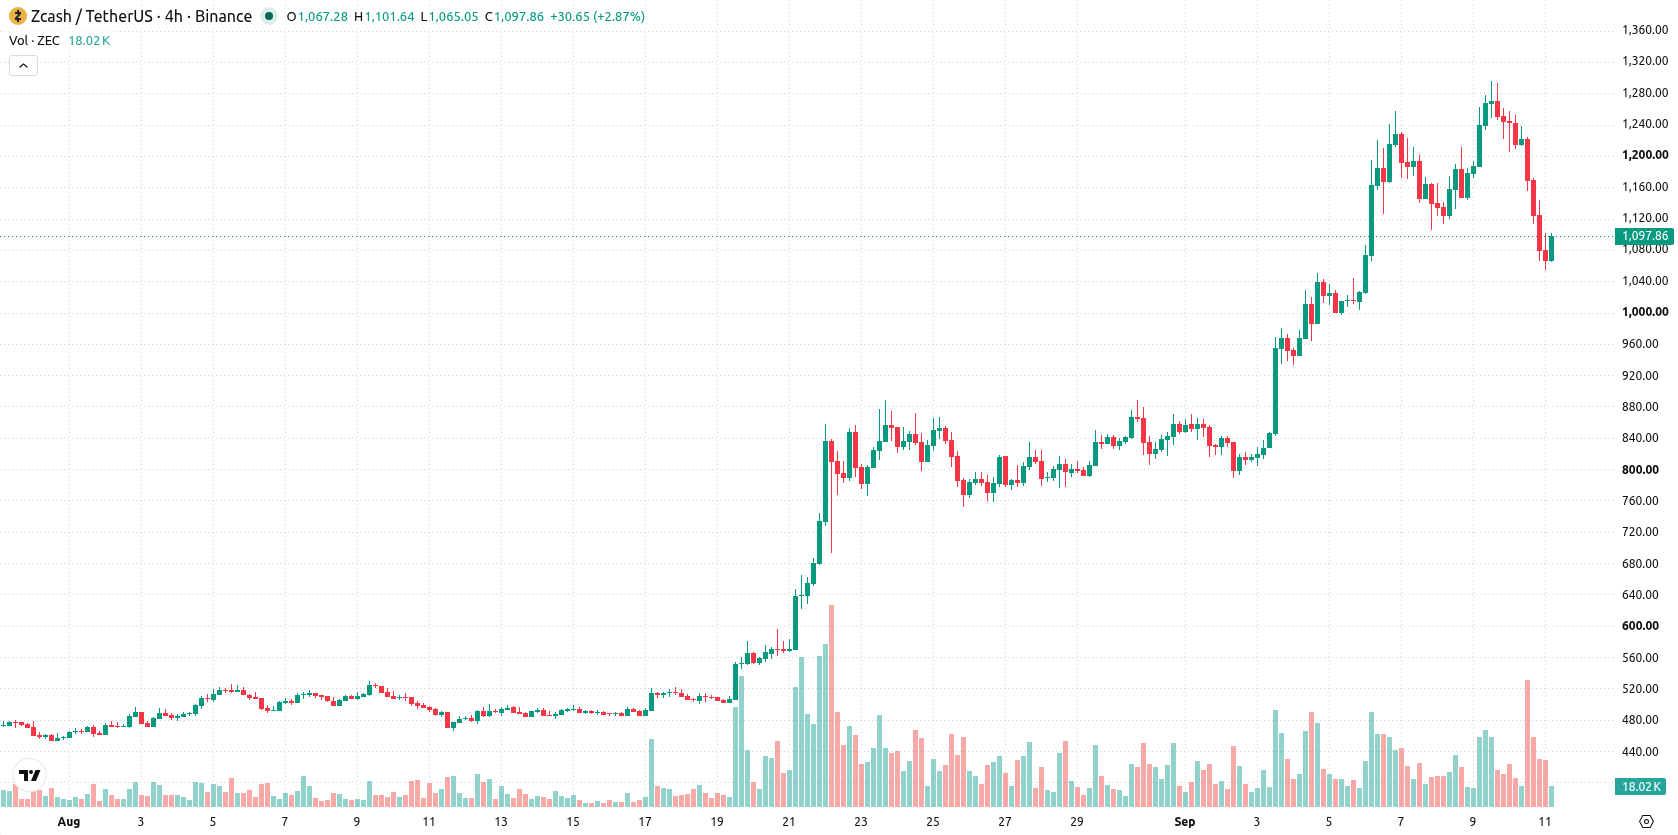
Zcash (ZEC) tumbled 10.78% after strong ETF-driven optimism faded, as recent institutional inflows and heavy short covering failed to prevent renewed selling pressure. The downside move is now constrained by the asset holding firm above its 20-day, 50-day, and 200-day moving averages, with well-defined support levels nearby.
 1225.1
1370.21
1225.1
1370.21
Highlights
- Zcash drew over $500 million in institutional inflows within two weeks after the Grayscale Zcash ETF (ZCSH) became available on NYSE Arca in late August 2026.
- More than $34.5 million in short positions closed in a single day as shielded address holdings rose to 4.85 million ZEC, and the Electric Coin Company team exited governance in January 2026.
- ZEC/USD remains in a bullish technical structure with the next resistance at $1,296 and a forecasted five-day range of $949.47 to $1,403.
Institutional inflows surge after ETF launch as shorts unwind
Zcash recorded a significant price rally following the Grayscale Zcash ETF (ZCSH) launch on NYSE Arca in late August 2026, which saw institutional inflows exceed $500 million within two weeks and absorbed over 464,000 ZEC. This event was accompanied by the closure of more than $34.5 million in short positions in a single day, and Zcash’s supply in shielded addresses increased to 4.85 million ZEC. There were also reports of developments in the network’s governance, including the departure of the Electric Coin Company team in January 2026, though price action has remained under broader selling pressure.
Mixed momentum as overbought signals diverge with bullish trend
ZEC/USD is trading above its 20-day, 50-day, and 200-day moving averages ($938.66, $678.04, and $468.28), confirming a persistent bullish structure across all timeframes. The immediate resistance stands at $1,296 and support at $1,093, establishing clear short-term boundaries. Momentum readings are robust, with both MACD and ADX indicating a bullish setup. The RSI is elevated at 67.09, nearing overbought territory, while the Stochastic RSI is oversold at 0, signaling a technical divergence. Additional indicators such as CCI and BBP also show overbought signals, with BBP at 222.74 pointing to dominant buy-side momentum. The Awesome Oscillator remains positive. The session revealed a downside gap of about $151.88 (12.33%) followed by a further decline to $1,098, with volatility at 1.38%. Divergence among oscillators suggests mixed short-term pressures after the gap move.
Previously it was reported that despite institutional inflows and the launch of the Zcash spot ETF, ZEC faced heightened volatility and significant selling pressure despite an overall bullish structure. The current analysis adds depth to that perspective, highlighting ongoing mixed technical signals and suggesting traders should closely monitor the $1,093 support as a potential pivot for the next directional move.










-
 Afghanistan
-
 Albania
-
 Algeria
-
 Angola
-
 Argentina
-
 Armenia
-
 Australia
-
 Austria
-
 Azerbaijan
-
 Bahamas
-
 Bahrain
-
 Bangladesh
-
 Belarus
-
 Belgium
-
 Bolivia
-
 Botswana
-
 Brazil
-
 Brunei
-
 Bulgaria
-
 Cambodia
-
 Cameroon
-
 Canada
-
 Chile
Chile
-
 China
China
-
 Colombia
-
 Congo
Congo
-
 Costa Rica
-
 Cote d'Ivoire
-
 Croatia
-
 Cuba
Cuba
-
 Cyprus
-
 Czechia
-
 DR Congo
-
 Denmark
-
 Dominican Republic
-
 Ecuador
-
 Egypt
Egypt
-
 El Salvador
-
 Estonia
-
 Eswatini
-
 Ethiopia
-
 Finland
-
 France
-
 Georgia
-
 Germany
-
 Ghana
Ghana
-
 Greece
-
 Haiti
Haiti
-
 Hong Kong
-
 Hungary
-
 India
India
-
 Indonesia
-
 Iran, Islamic republic
-
 Iraq
Iraq
-
 Ireland
-
 Israel
-
 Italy
Italy
-
 Jamaica
-
 Japan
Japan
-
 Jordan
-
 Kazakhstan
-
 Kenya
Kenya
-
 Korea
Korea
-
 Kuwait
-
 Kyrgyzstan
-
 Laos
Laos
-
 Latvia
-
 Lebanon
-
 Lesotho
-
 Libya
Libya
-
 Lithuania
-
 Luxembourg
-
 Madagascar
-
 Malaysia
-
 Malta
Malta
-
 Mauritius
-
 Mexico
-
 Moldova
-
 Mongolia
-
 Montenegro
-
 Morocco
-
 Mozambique
-
 Myanmar
-
 Namibia
-
 Nepal
Nepal
-
 Netherlands
-
 New Zealand
-
 Nigeria
-
 North Macedonia
-
 Norway
-
 Oman
Oman
-
 Pakistan
-
 Palestine
-
 Panama
-
 Papua New Guinea
-
 Paraguay
-
 Peru
Peru
-
 Philippines
-
 Poland
-
 Portugal
-
 Puerto Rico
-
 Qatar
Qatar
-
 Reunion
-
 Romania
-
 Rwanda
-
 Saudi Arabia
-
 Serbia
-
 Singapore
-
 Slovakia
-
 Slovenia
-
 Somalia
-
 South Africa
-
 Spain
Spain
-
 Sri Lanka
-
 Sweden
-
 Switzerland
-
 Syria
Syria
-
 Taiwan
-
 Tajikistan
-
 Tanzania
-
 Thailand
-
 Trinidad and Tobago
-
 Tunisia
-
 Turkey
-
 UAE
UAE
-
 Uganda
-
 Ukraine
-
 United Kingdom
-
United States
-
 Uruguay
-
 Uzbekistan
-
 Venezuela
-
 Vietnam
-
 Yemen
Yemen
-
 Zambia
-
 Zimbabwe
- Forex
- Crypto












