

Will Saros break resistance as price stalls near intraday highs?

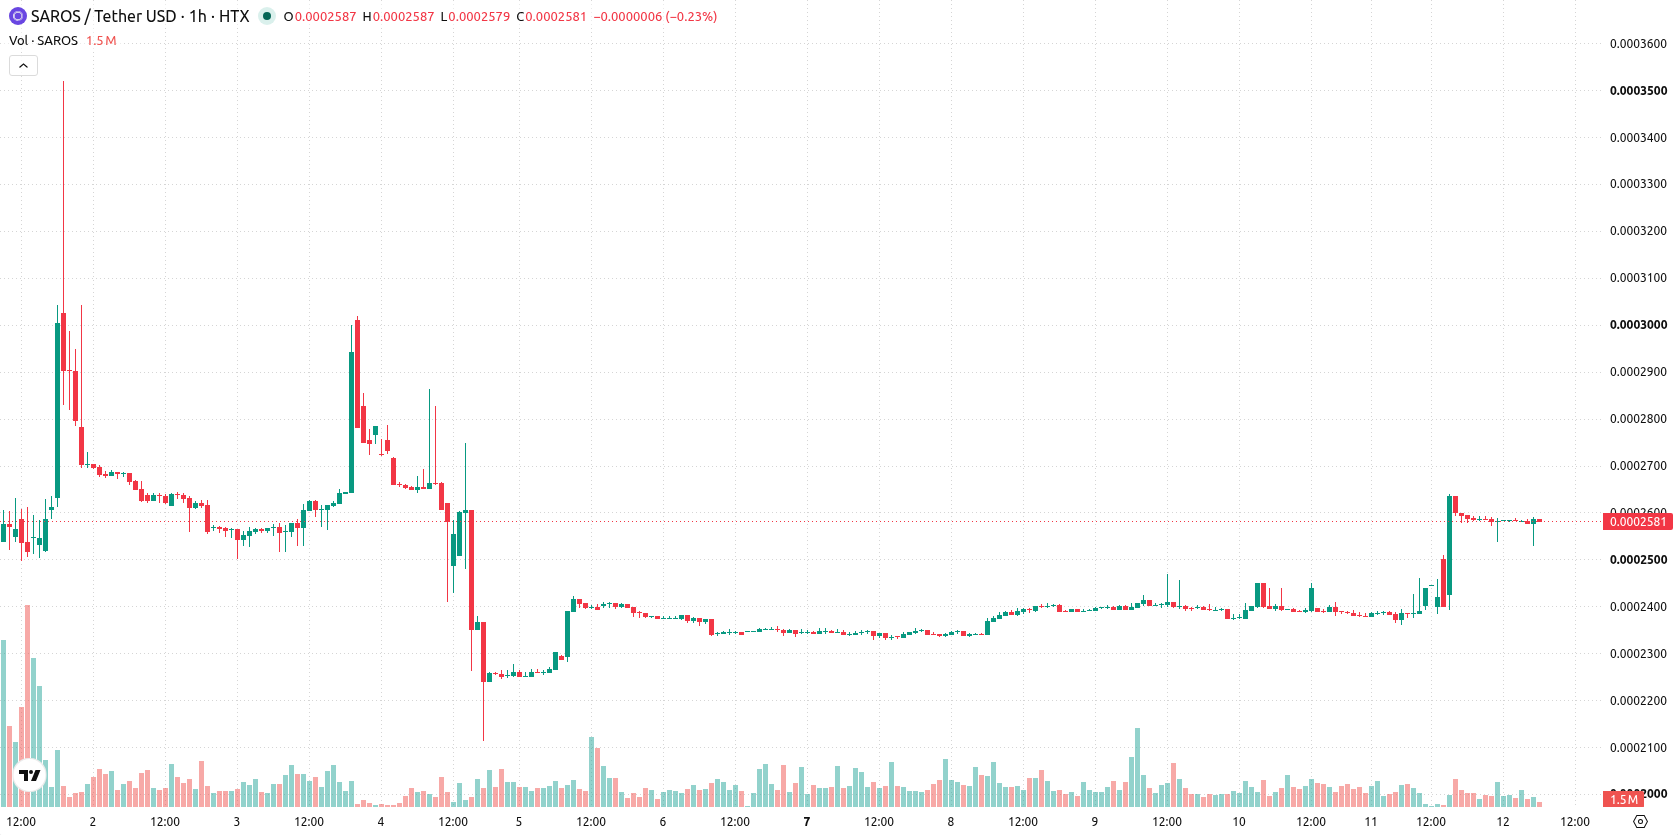
Saros (SAROS) is trading at $0.0003, advancing 9.68% on the day. The price is currently positioned above its key short- and medium-term moving averages but remains beneath longer-term markers.
 0.0004
0.000730
0.0004
0.000730
Highlights
- SAROS/USD shows strong intraday bullish momentum with price up 9.68% and trading near the session high.
- Mixed momentum and oscillator signals suggest current upside is not fully confirmed, as intraday technicals and longer-term trends diverge.
- Expected price range for the next two to three trading days is $0.0002 to $0.0003, with sideways consolidation as the baseline scenario.
Mixed momentum amid divergence and volatility at resistance
On the technical front, SAROS has established itself above both the MA-20 and MA-50 on the hourly chart, while still trading below the MA-200 on the daily timeframe. The Ichimoku Kijun level at $0.0002 serves as immediate support. Momentum indicators present a mixed outlook: MACD signals a strong buy, ADX indicates a buy, RSI stands at 50.94 (Buy), Stoch RSI is oversold, CCI remains neutral, and Bull/Bear Power highlights intraday buyer strength. The Awesome Oscillator is currently neutral, and price action is near the day's high amid high volatility, with oscillators and momentum readings displaying divergence and cautioning against a one-sided bias.
Sideways trading likely as volatility tempers breakout risk
In the short term, SAROS is expected to consolidate in the $0.0002–$0.0003 range over the next two to three trading days. The baseline scenario favors sideways movement within this corridor. A bullish breakout above resistance would target the upper end of this volatility band, while a bearish move below immediate support near the Kijun level at $0.0002 could open up further downside.
Earlier, analysts noted that Saros was shifting to a more constructive and bullish technical setup, with momentum building but risks of a near-term pullback persisting. The latest analysis adds that although the asset remains buoyant above key moving averages, traders should monitor shifts in momentum and heightened volatility, as unexpected breakouts or breakdowns from the current range could prompt sharp directional moves.





Latest Saros News





-
 Afghanistan
-
 Albania
-
 Algeria
-
 Angola
-
 Argentina
-
 Armenia
-
 Australia
-
 Austria
-
 Azerbaijan
-
 Bahamas
-
 Bahrain
-
 Bangladesh
-
 Belarus
-
 Belgium
-
 Bolivia
-
 Botswana
-
 Brazil
-
 Brunei
-
 Bulgaria
-
 Cambodia
-
 Cameroon
-
 Canada
-
 Chile
Chile
-
 China
China
-
 Colombia
-
 Congo
Congo
-
 Costa Rica
-
 Cote d'Ivoire
-
 Croatia
-
 Cuba
Cuba
-
 Cyprus
-
 Czechia
-
 DR Congo
-
 Denmark
-
 Dominican Republic
-
 Ecuador
-
 Egypt
Egypt
-
 El Salvador
-
 Estonia
-
 Eswatini
-
 Ethiopia
-
 Finland
-
 France
-
 Georgia
-
 Germany
-
 Ghana
Ghana
-
 Greece
-
 Haiti
Haiti
-
 Hong Kong
-
 Hungary
-
 India
India
-
 Indonesia
-
 Iran, Islamic republic
-
 Iraq
Iraq
-
 Ireland
-
 Israel
-
 Italy
Italy
-
 Jamaica
-
 Japan
Japan
-
 Jordan
-
 Kazakhstan
-
 Kenya
Kenya
-
 Korea
Korea
-
 Kuwait
-
 Kyrgyzstan
-
 Laos
Laos
-
 Latvia
-
 Lebanon
-
 Lesotho
-
 Libya
Libya
-
 Lithuania
-
 Luxembourg
-
 Madagascar
-
 Malaysia
-
 Malta
Malta
-
 Mauritius
-
 Mexico
-
 Moldova
-
 Mongolia
-
 Montenegro
-
 Morocco
-
 Mozambique
-
 Myanmar
-
 Namibia
-
 Nepal
Nepal
-
 Netherlands
-
 New Zealand
-
 Nigeria
-
 North Macedonia
-
 Norway
-
 Oman
Oman
-
 Pakistan
-
 Palestine
-
 Panama
-
 Papua New Guinea
-
 Paraguay
-
 Peru
Peru
-
 Philippines
-
 Poland
-
 Portugal
-
 Puerto Rico
-
 Qatar
Qatar
-
 Reunion
-
 Romania
-
 Rwanda
-
 Saudi Arabia
-
 Serbia
-
 Singapore
-
 Slovakia
-
 Slovenia
-
 Somalia
-
 South Africa
-
 Spain
Spain
-
 Sri Lanka
-
 Sweden
-
 Switzerland
-
 Syria
Syria
-
 Taiwan
-
 Tajikistan
-
 Tanzania
-
 Thailand
-
 Trinidad and Tobago
-
 Tunisia
-
 Turkey
-
 UAE
UAE
-
 Uganda
-
 Ukraine
-
 United Kingdom
-
United States
-
 Uruguay
-
 Uzbekistan
-
 Venezuela
-
 Vietnam
-
 Yemen
Yemen
-
 Zambia
-
 Zimbabwe
- Forex
- Crypto












