

Tezos drops over 10% after selling pressure intensifies and price slips below 200-day average

Tezos (XTZ) dropped 10.22% today as selling pressure dominated the open, with price action falling below key short-term resistance levels. This decline is supported by a persistent bearish structure, as the asset remains under its 200-day moving average despite some signs of underlying positive momentum on shorter timeframes.
 0.2518
0.28650000
Highlights
- XTZ/USD trades above its 20-day and 50-day moving averages but remains below the 200-day, indicating short-term strength within a longer-term bearish structure.
- Near-term resistance is $0.2567 and support is $0.2459, with the expected 5-day trading range at $0.21805 to $0.3035.
- Indicator signals are mixed with upward momentum and overbought conditions, and intraday volatility reached 12.73% as price fell 10.22% today.
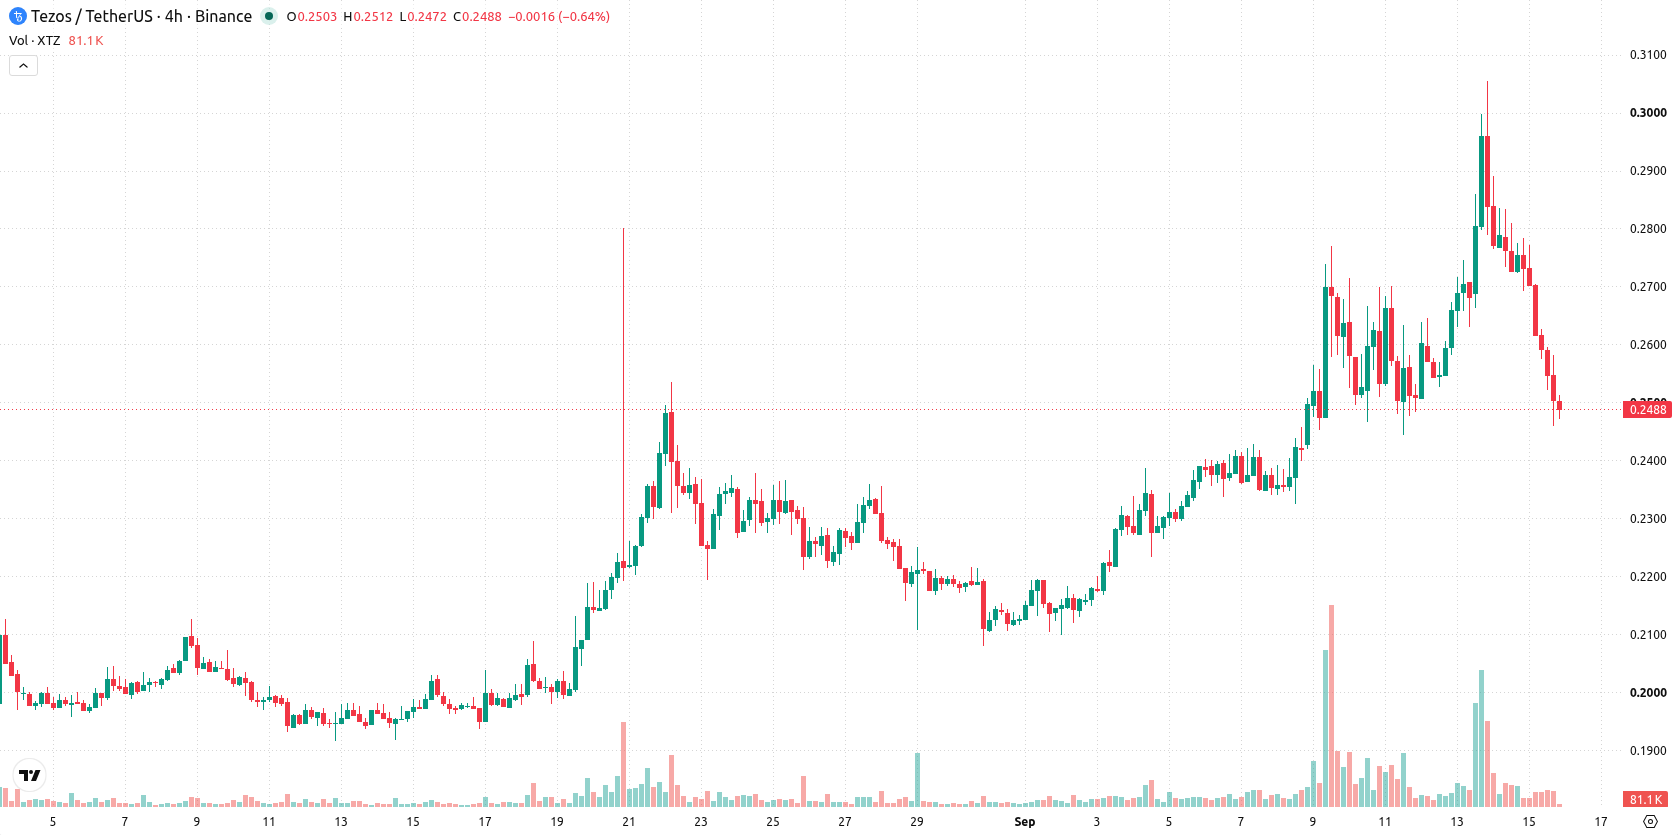
Mixed bullish signals as price lags long-term averages amid volatility
XTZ/USD is trading above its 20-day and 50-day moving averages at $0.2486, both of which are $0.23868 and $0.21967, indicating near-term and medium-term positive momentum. However, the price remains below the longer-term 200-day average at $0.292083, underlining longer-term bearish alignment. Near-term resistance sits at $0.2567 with support at $0.2459. Momentum signals are mixed: both the MACD and ADX indicate strengthening upward momentum, with readings at buy levels. The RSI is elevated at 68.67 ("Buy"), and both the Stochastic RSI and CCI suggest overbought conditions, highlighting the risk of a short-term pullback. Bull/Bear Power indicates buyers are in control, and the Awesome Oscillator supports underlying bullishness. The price is down $0.0283 or 10.22% today following a downside gap of approximately 1.37%, trading near the session low. Intraday volatility stands at 12.73%, suggesting persistent selling pressure after the open despite strong underlying momentum signals.
Earlier, analysts noted that Tezos was exhibiting persistent bearish momentum, with downside risks dominating the technical outlook. The current analysis adds a new dimension as mixed momentum signals suggest potential for a short-term rebound, making $0.2459 a key support level to monitor for confirmation of direction.











-
 Afghanistan
-
 Albania
-
 Algeria
-
 Angola
-
 Argentina
-
 Armenia
-
 Australia
-
 Austria
-
 Azerbaijan
-
 Bahamas
-
 Bahrain
-
 Bangladesh
-
 Belarus
-
 Belgium
-
 Bolivia
-
 Botswana
-
 Brazil
-
 Brunei
-
 Bulgaria
-
 Cambodia
-
 Cameroon
-
 Canada
-
 Chile
-
 China
-
 Colombia
-
 Congo
-
 Costa Rica
-
 Cote d'Ivoire
-
 Croatia
-
 Cuba
-
 Cyprus
-
 Czechia
-
 DR Congo
-
 Denmark
-
 Dominican Republic
-
 Ecuador
-
 Egypt
-
 El Salvador
-
 Estonia
-
 Eswatini
-
 Ethiopia
-
 Finland
-
 France
-
 Georgia
-
 Germany
-
 Ghana
-
 Greece
-
 Haiti
-
 Hong Kong
-
 Hungary
-
 India
-
 Indonesia
-
 Iran, Islamic republic
-
 Iraq
-
 Ireland
-
 Israel
-
 Italy
-
 Jamaica
-
 Japan
-
 Jordan
-
 Kazakhstan
-
 Kenya
-
 Korea
-
 Kuwait
-
 Kyrgyzstan
-
 Laos
-
 Latvia
-
 Lebanon
-
 Lesotho
-
 Libya
-
 Lithuania
-
 Luxembourg
-
 Madagascar
-
 Malaysia
-
 Malta
-
 Mauritius
-
 Mexico
-
 Moldova
-
 Mongolia
-
 Montenegro
-
 Morocco
-
 Mozambique
-
 Myanmar
-
 Namibia
-
 Nepal
-
 Netherlands
-
 New Zealand
-
 Nigeria
-
 North Macedonia
-
 Norway
-
 Oman
-
 Pakistan
-
 Palestine
-
 Panama
-
 Papua New Guinea
-
 Paraguay
-
 Peru
-
 Philippines
-
 Poland
-
 Portugal
-
 Puerto Rico
-
 Qatar
-
 Reunion
-
 Romania
-
 Rwanda
-
 Saudi Arabia
-
 Serbia
-
 Singapore
-
 Slovakia
-
 Slovenia
-
 Somalia
-
 South Africa
-
 Spain
-
 Sri Lanka
-
 Sweden
-
 Switzerland
-
 Syria
-
 Taiwan
-
 Tajikistan
-
 Tanzania
-
 Thailand
-
 Trinidad and Tobago
-
 Tunisia
-
 Turkey
-
 UAE
-
 Uganda
-
 Ukraine
-
 United Kingdom
-
United States
-
 Uruguay
-
 Uzbekistan
-
 Venezuela
-
 Vietnam
-
 Yemen
-
 Zambia
-
 Zimbabwe
- Forex
- Crypto












