


Momentum signals have driven a 10.88% surge in The Graph (GRT) today, as technical buying interest dominates. The advance looks limited, with the price still below the 200-day moving average, reflecting persistent long-term trend pressure.
 0.0188
0.02108000
Highlights
- GRT/USD is trading above its short- and medium-term moving averages but remains below the long-term average, indicating persistent long-term bearish pressure.
- Momentum indicators are positive, with MACD and ADX forecasting continued upside while RSI and other oscillators remain neutral.
- Expected trading range for the next five days is $0.018745 to $0.021015, with a high probability of price consolidation or upside move above $0.01998.
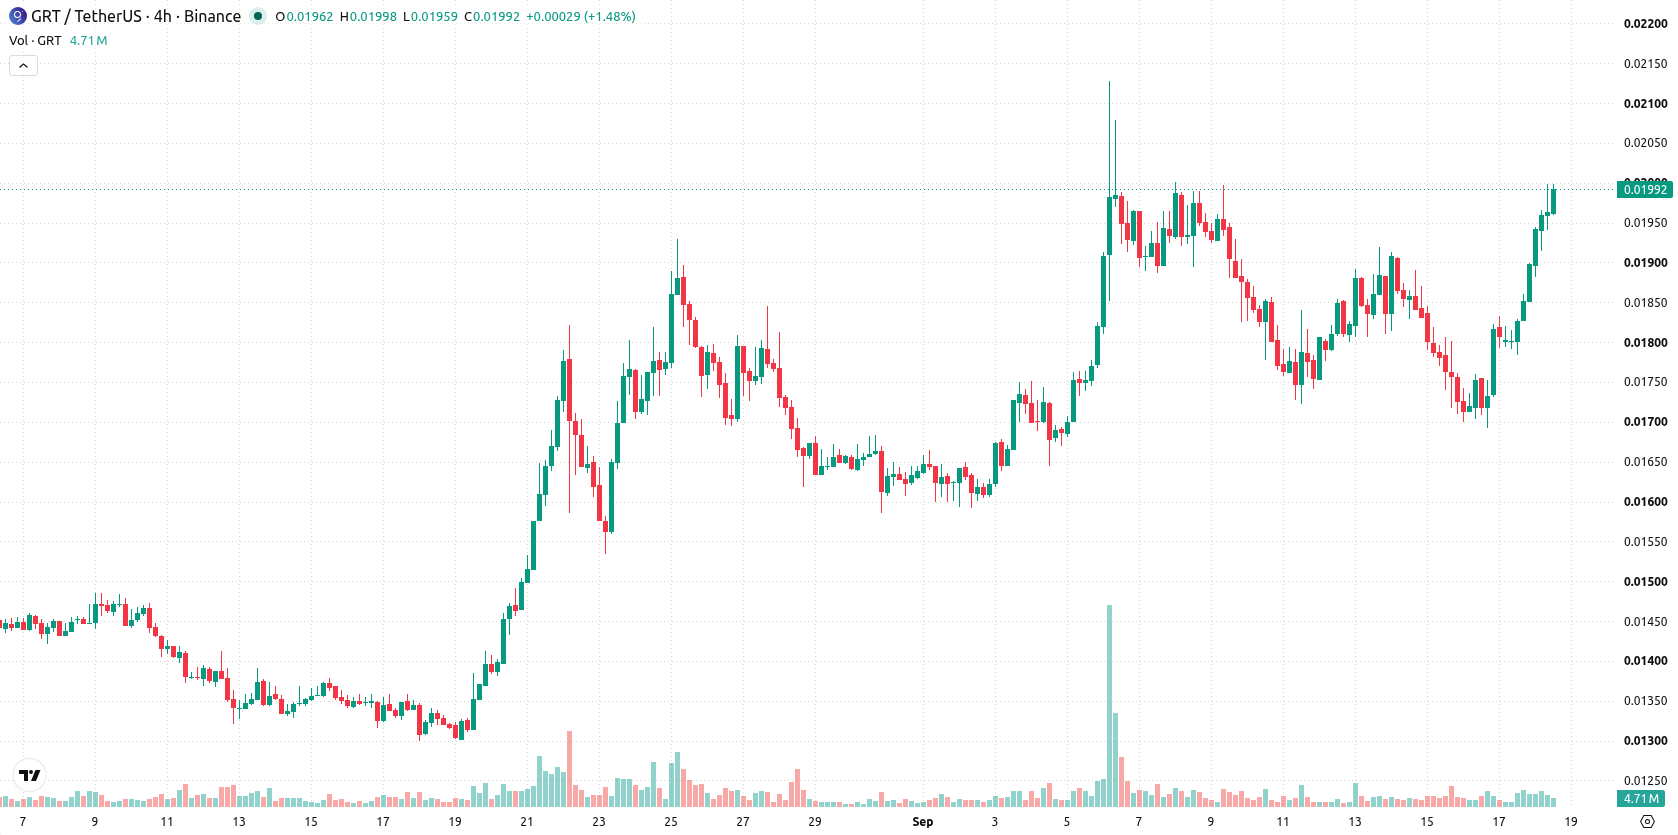
Upside bias sustained as momentum indicators outweigh long-term resistance
GRT/USD is trading above its 20-day ($0.0177505) and 50-day ($0.0160982) moving averages, indicating ongoing short- and medium-term buying interest. However, the price remains below the 200-day ($0.021065) moving average, which continues to signal bearish pressure in the longer term. Closest support stands at $0.01919 (week high) and resistance at $0.01998 (today high). Momentum signals are positive, with both the MACD and Average Directional Index (ADX) forecasting further upside. RSI is at 56.86, in neutral territory, with Stochastic RSI and CCI also neutral, suggesting the pair is neither overbought nor oversold. Bull/Bear Power (BBP) is positive at 0.00060333, showing buyers have intraday control. The price is near the daily high after intraday volatility of 6.16%, reflecting a firm tone aligned with the day's momentum.
Earlier, analysts noted that The Graph was exhibiting short-term bullish momentum, with attention focused on whether key support levels could sustain further advances. Today’s technical setup reinforces that outlook, as buyers maintain intraday control and upside risk remains elevated should the price clear immediate resistance at $0.01998.











-
 Afghanistan
-
 Albania
-
 Algeria
-
 Angola
-
 Argentina
-
 Armenia
-
 Australia
-
 Austria
-
 Azerbaijan
-
 Bahamas
-
 Bahrain
-
 Bangladesh
-
 Belarus
-
 Belgium
-
 Bolivia
-
 Botswana
-
 Brazil
-
 Brunei
-
 Bulgaria
-
 Cambodia
-
 Cameroon
-
 Canada
-
 Chile
-
 China
-
 Colombia
-
 Congo
-
 Costa Rica
-
 Cote d'Ivoire
-
 Croatia
-
 Cuba
-
 Cyprus
-
 Czechia
-
 DR Congo
-
 Denmark
-
 Dominican Republic
-
 Ecuador
-
 Egypt
-
 El Salvador
-
 Estonia
-
 Eswatini
-
 Ethiopia
-
 Finland
-
 France
-
 Georgia
-
 Germany
-
 Ghana
-
 Greece
-
 Haiti
-
 Hong Kong
-
 Hungary
-
 India
-
 Indonesia
-
 Iran, Islamic republic
-
 Iraq
-
 Ireland
-
 Israel
-
 Italy
-
 Jamaica
-
 Japan
-
 Jordan
-
 Kazakhstan
-
 Kenya
-
 Korea
-
 Kuwait
-
 Kyrgyzstan
-
 Laos
-
 Latvia
-
 Lebanon
-
 Lesotho
-
 Libya
-
 Lithuania
-
 Luxembourg
-
 Madagascar
-
 Malaysia
-
 Malta
-
 Mauritius
-
 Mexico
-
 Moldova
-
 Mongolia
-
 Montenegro
-
 Morocco
-
 Mozambique
-
 Myanmar
-
 Namibia
-
 Nepal
-
 Netherlands
-
 New Zealand
-
 Nigeria
-
 North Macedonia
-
 Norway
-
 Oman
-
 Pakistan
-
 Palestine
-
 Panama
-
 Papua New Guinea
-
 Paraguay
-
 Peru
-
 Philippines
-
 Poland
-
 Portugal
-
 Puerto Rico
-
 Qatar
-
 Reunion
-
 Romania
-
 Rwanda
-
 Saudi Arabia
-
 Serbia
-
 Singapore
-
 Slovakia
-
 Slovenia
-
 Somalia
-
 South Africa
-
 Spain
-
 Sri Lanka
-
 Sweden
-
 Switzerland
-
 Syria
-
 Taiwan
-
 Tajikistan
-
 Tanzania
-
 Thailand
-
 Trinidad and Tobago
-
 Tunisia
-
 Turkey
-
 UAE
-
 Uganda
-
 Ukraine
-
 United Kingdom
-
United States
-
 Uruguay
-
 Uzbekistan
-
 Venezuela
-
 Vietnam
-
 Yemen
-
 Zambia
-
 Zimbabwe
- Forex
- Crypto












