

Render recovery holds but faces a stretched setup as overbought signals emerge: weekly analysis

Render Network (RENDER) is holding near $1.52 after a gains of more than 10% over the past week, as a strong technical setup meets overbought signals. While buyers remain in control, the chart points to stretched conditions as the recovery matures and next week's direction depends on whether momentum can sustain or triggers a pause.
 1.499
1.7200
Highlights
- Render traded up 10.6% over the past week to $1.524, breaking above short-term moving averages but staying below long-term trend levels.
- Technical indicators show momentum stretched into overbought territory with 27.34% weekly volatility and buyers dominant.
- Render is expected to stay within a $1.3382 to $1.8 range next week, with key support at $1.4595 and resistance at $1.635.
Token migration to Solana drives volumes as AI and GPU demand accelerate
Render completed the transition of nearly its entire token supply to the Solana blockchain as of September 10, according to openPR.com, positioning the network for faster transactions and reduced costs in the week ahead. Trading volumes remained robust, with $12.43 million turning over on September 13, according to dailypolitical.com. Renewed interest in AI-related crypto assets and decentralized GPU computing also drove demand, with new capital flows and increased activity reported by several industry outlets.
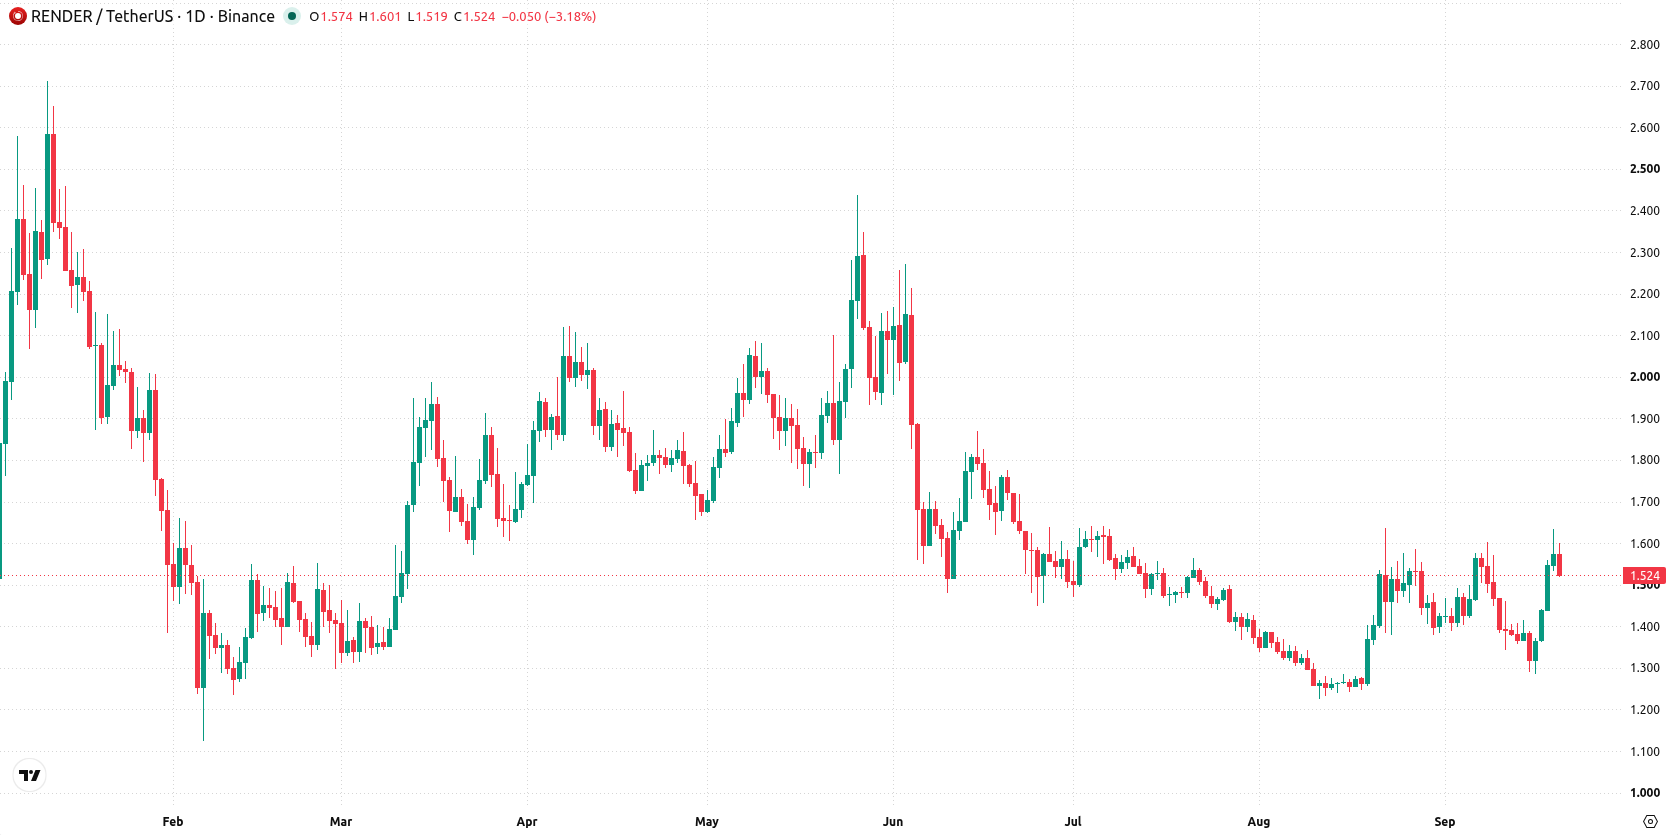
Overbought signals emerge as weekly volatility spikes and trend remains unconfirmed
The daily chart shows a developing trend with a sharp move higher without a sustained trend, as reflected by 27.34% weekly volatility. Both the RSI at 61.1027 (approaching overbought) and the CCI in the overbought zone highlight stretched momentum, even as Bull/Bear Power signals buyers remain dominant. Nearest support comes in at $1.4595 (Ichimoku Kijun), while resistance stands at $1.635, the recent weekly high. This setup suggests price action is strong but adoption of a sustained uptrend is yet unconfirmed.
Upside risk dominates outlook as rangebound trade hinges on breakout levels
Next week, Render is expected to trade in a range between $1.3382 and $1.8, with a very high probability of an increase and a very low probability of a decrease. If the price holds between support at $1.4595 and resistance at $1.635, expect ongoing consolidation with an upward bias. A break above $1.635 would open the way toward the upper end of the expected range. Should support at $1.4595 fail, downside risk moves toward $1.3382.
Earlier, analysts noted that Render Network's upside was capped by resistance and conflicting momentum signals, reflecting a cautious bias amid short- and medium-term strength. The latest developments around the Solana transition and persistent overbought readings reinforce the case for closely monitoring the $1.4595 support and $1.635 resistance as pivots for the next decisive move.










-
 Afghanistan
-
 Albania
-
 Algeria
-
 Angola
-
 Argentina
-
 Armenia
-
 Australia
-
 Austria
-
 Azerbaijan
-
 Bahamas
-
 Bahrain
-
 Bangladesh
-
 Belarus
-
 Belgium
-
 Bolivia
-
 Botswana
-
 Brazil
-
 Brunei
-
 Bulgaria
-
 Cambodia
-
 Cameroon
-
 Canada
-
 Chile
-
 China
-
 Colombia
-
 Congo
-
 Costa Rica
-
 Cote d'Ivoire
-
 Croatia
-
 Cuba
-
 Cyprus
-
 Czechia
-
 DR Congo
-
 Denmark
-
 Dominican Republic
-
 Ecuador
-
 Egypt
-
 El Salvador
-
 Estonia
-
 Eswatini
-
 Ethiopia
-
 Finland
-
 France
-
 Georgia
-
 Germany
-
 Ghana
-
 Greece
-
 Haiti
-
 Hong Kong
-
 Hungary
-
 India
-
 Indonesia
-
 Iran, Islamic republic
-
 Iraq
-
 Ireland
-
 Israel
-
 Italy
-
 Jamaica
-
 Japan
-
 Jordan
-
 Kazakhstan
-
 Kenya
-
 Korea
-
 Kuwait
-
 Kyrgyzstan
-
 Laos
-
 Latvia
-
 Lebanon
-
 Lesotho
-
 Libya
-
 Lithuania
-
 Luxembourg
-
 Madagascar
-
 Malaysia
-
 Malta
-
 Mauritius
-
 Mexico
-
 Moldova
-
 Mongolia
-
 Montenegro
-
 Morocco
-
 Mozambique
-
 Myanmar
-
 Namibia
-
 Nepal
-
 Netherlands
-
 New Zealand
-
 Nigeria
-
 North Macedonia
-
 Norway
-
 Oman
-
 Pakistan
-
 Palestine
-
 Panama
-
 Papua New Guinea
-
 Paraguay
-
 Peru
-
 Philippines
-
 Poland
-
 Portugal
-
 Puerto Rico
-
 Qatar
-
 Reunion
-
 Romania
-
 Rwanda
-
 Saudi Arabia
-
 Serbia
-
 Singapore
-
 Slovakia
-
 Slovenia
-
 Somalia
-
 South Africa
-
 Spain
-
 Sri Lanka
-
 Sweden
-
 Switzerland
-
 Syria
-
 Taiwan
-
 Tajikistan
-
 Tanzania
-
 Thailand
-
 Trinidad and Tobago
-
 Tunisia
-
 Turkey
-
 UAE
-
 Uganda
-
 Ukraine
-
 United Kingdom
-
United States
-
 Uruguay
-
 Uzbekistan
-
 Venezuela
-
 Vietnam
-
 Yemen
-
 Zambia
-
 Zimbabwe
- Forex
- Crypto












