


A surge of bullish technical momentum drove The Graph (GRT) up 11.28% today, powered by strong trend signals and heavy buying pressure. The latest rally remains supported as GRT trades above all major moving averages, though extended overbought readings and a bearish long-term moving average alignment raise the risk of a near-term pause.
 0.02821
0.02922000
0.02821
0.02922000
Highlights
- GRT/USD trades just below the weekly high near $0.02272 with immediate support at $0.02204 and short-term bullish momentum.
- Multiple trend indicators confirm strong upward movement, but overbought readings signal elevated risk of a near-term pullback.
- Expected 5-day range is $0.01979 to $0.02559 with a probability above 80% for further gains and below 20% for decline.
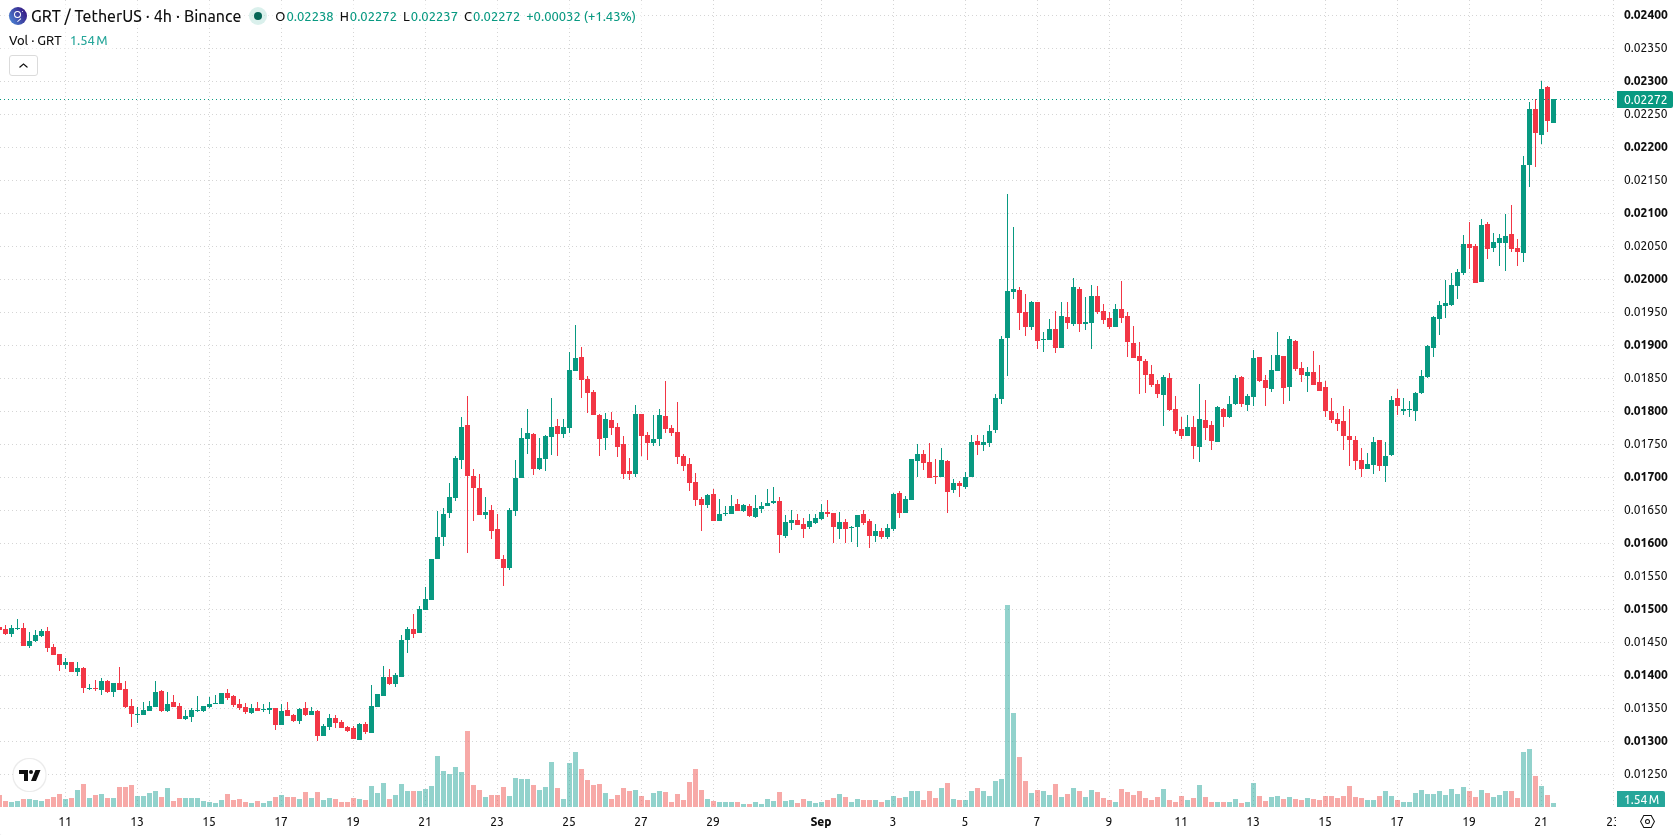
Overbought signals and bullish trend as price nears range ceiling
GRT/USD is trading above the 20-day ($0.0185055), 50-day ($0.0165136), and 200-day ($0.0209915) moving averages, reflecting clear bullish momentum across short-, medium-, and long-term trends. The price sits just below the week high near the near-term ceiling of $0.02272, with the near-term floor at $0.02204 serving as immediate support. The current configuration is reinforced by a bearish long-term alignment between the 50-day and 200-day moving averages. Momentum signals are strong, with the MACD and ADX both suggesting the uptrend remains intact. The RSI at 73.40 and CCI at 202.74 indicate overbought conditions, echoed by a Stochastic RSI of 100. Bull/Bear Power (BBP) is positive at 0.00343997, signaling buyers dominate intraday action. These overbought readings caution about potential pullbacks. The Awesome Oscillator (AO) also supports ongoing bullish sentiment. GRT/USD advanced $0.0023 or 11.28% today after an upside opening gap of about $0.0018 (8.83%), with price positioned near the day’s high as intraday volatility stands at 4.36%. The intraday tone remains bullish with strong momentum into the upper end of the range.
Earlier, analysts noted that The Graph was maintaining a bullish trajectory supported by strong technical momentum and persistent buying pressure. The latest developments reinforce this view, with overbought signals suggesting traders should monitor for possible short-term corrections around $0.02204, while sustained momentum could drive price action toward the upper end of the projected five-day range.











-
 Afghanistan
-
 Albania
-
 Algeria
-
 Angola
-
 Argentina
-
 Armenia
-
 Australia
-
 Austria
-
 Azerbaijan
-
 Bahamas
-
 Bahrain
-
 Bangladesh
-
 Belarus
-
 Belgium
-
 Bolivia
-
 Botswana
-
 Brazil
-
 Brunei
-
 Bulgaria
-
 Cambodia
-
 Cameroon
-
 Canada
-
 Chile
Chile
-
 China
China
-
 Colombia
-
 Congo
Congo
-
 Costa Rica
-
 Cote d'Ivoire
-
 Croatia
-
 Cuba
Cuba
-
 Cyprus
-
 Czechia
-
 DR Congo
-
 Denmark
-
 Dominican Republic
-
 Ecuador
-
 Egypt
Egypt
-
 El Salvador
-
 Estonia
-
 Eswatini
-
 Ethiopia
-
 Finland
-
 France
-
 Georgia
-
 Germany
-
 Ghana
Ghana
-
 Greece
-
 Haiti
Haiti
-
 Hong Kong
-
 Hungary
-
 India
India
-
 Indonesia
-
 Iran, Islamic republic
-
 Iraq
Iraq
-
 Ireland
-
 Israel
-
 Italy
Italy
-
 Jamaica
-
 Japan
Japan
-
 Jordan
-
 Kazakhstan
-
 Kenya
Kenya
-
 Korea
Korea
-
 Kuwait
-
 Kyrgyzstan
-
 Laos
Laos
-
 Latvia
-
 Lebanon
-
 Lesotho
-
 Libya
Libya
-
 Lithuania
-
 Luxembourg
-
 Madagascar
-
 Malaysia
-
 Malta
Malta
-
 Mauritius
-
 Mexico
-
 Moldova
-
 Mongolia
-
 Montenegro
-
 Morocco
-
 Mozambique
-
 Myanmar
-
 Namibia
-
 Nepal
Nepal
-
 Netherlands
-
 New Zealand
-
 Nigeria
-
 North Macedonia
-
 Norway
-
 Oman
Oman
-
 Pakistan
-
 Palestine
-
 Panama
-
 Papua New Guinea
-
 Paraguay
-
 Peru
Peru
-
 Philippines
-
 Poland
-
 Portugal
-
 Puerto Rico
-
 Qatar
Qatar
-
 Reunion
-
 Romania
-
 Rwanda
-
 Saudi Arabia
-
 Serbia
-
 Singapore
-
 Slovakia
-
 Slovenia
-
 Somalia
-
 South Africa
-
 Spain
Spain
-
 Sri Lanka
-
 Sweden
-
 Switzerland
-
 Syria
Syria
-
 Taiwan
-
 Tajikistan
-
 Tanzania
-
 Thailand
-
 Trinidad and Tobago
-
 Tunisia
-
 Turkey
-
 UAE
UAE
-
 Uganda
-
 Ukraine
-
 United Kingdom
-
United States
-
 Uruguay
-
 Uzbekistan
-
 Venezuela
-
 Vietnam
-
 Yemen
Yemen
-
 Zambia
-
 Zimbabwe
- Forex
- Crypto












