

Hedera pullback continues amid intense seller pressure at key technical areas

Hedera (HBAR) is trading at $0.0913, down 7.69% for the day. The price is currently above its key long-term averages but remains below shorter-term levels.
 0.0721
0.0776
Highlights
- IDTrust, a self-sovereign identity platform built on Hedera, is now listed on the IBM Cloud Catalog, increasing enterprise exposure.
- Hedera introduced the CLPR protocol to enable cross-ledger verification and EQTYLab plans to tokenize assets on the network.
- HBAR/USD is projected to trade between $0.0853 and $0.0973 over the next 2 to 3 days, with 59% probability of an upward move as indicator signals remain mixed.
Enterprise adoption expands as technical advances offset price weakness
The most significant recent development for Hedera is The Hashgraph Group's announcement that its IDTrust self-sovereign identity platform, built on Hedera, has been validated and listed on the IBM Cloud Catalog as of September 23, 2026, according to Finance Yahoo. This introduces the first commercial Hedera enterprise application to a major cloud marketplace, expanding the network's enterprise reach and integration potential. In addition, Hedera has launched its CLPR protocol to improve interoperability by enabling independent ledger verification through cryptographic proofs, while EQTYLab's plans to tokenize assets on the network further highlight the broadening scope of Hedera's use cases. These positive enterprise and technical developments have emerged even as price action has remained under broader selling pressure.
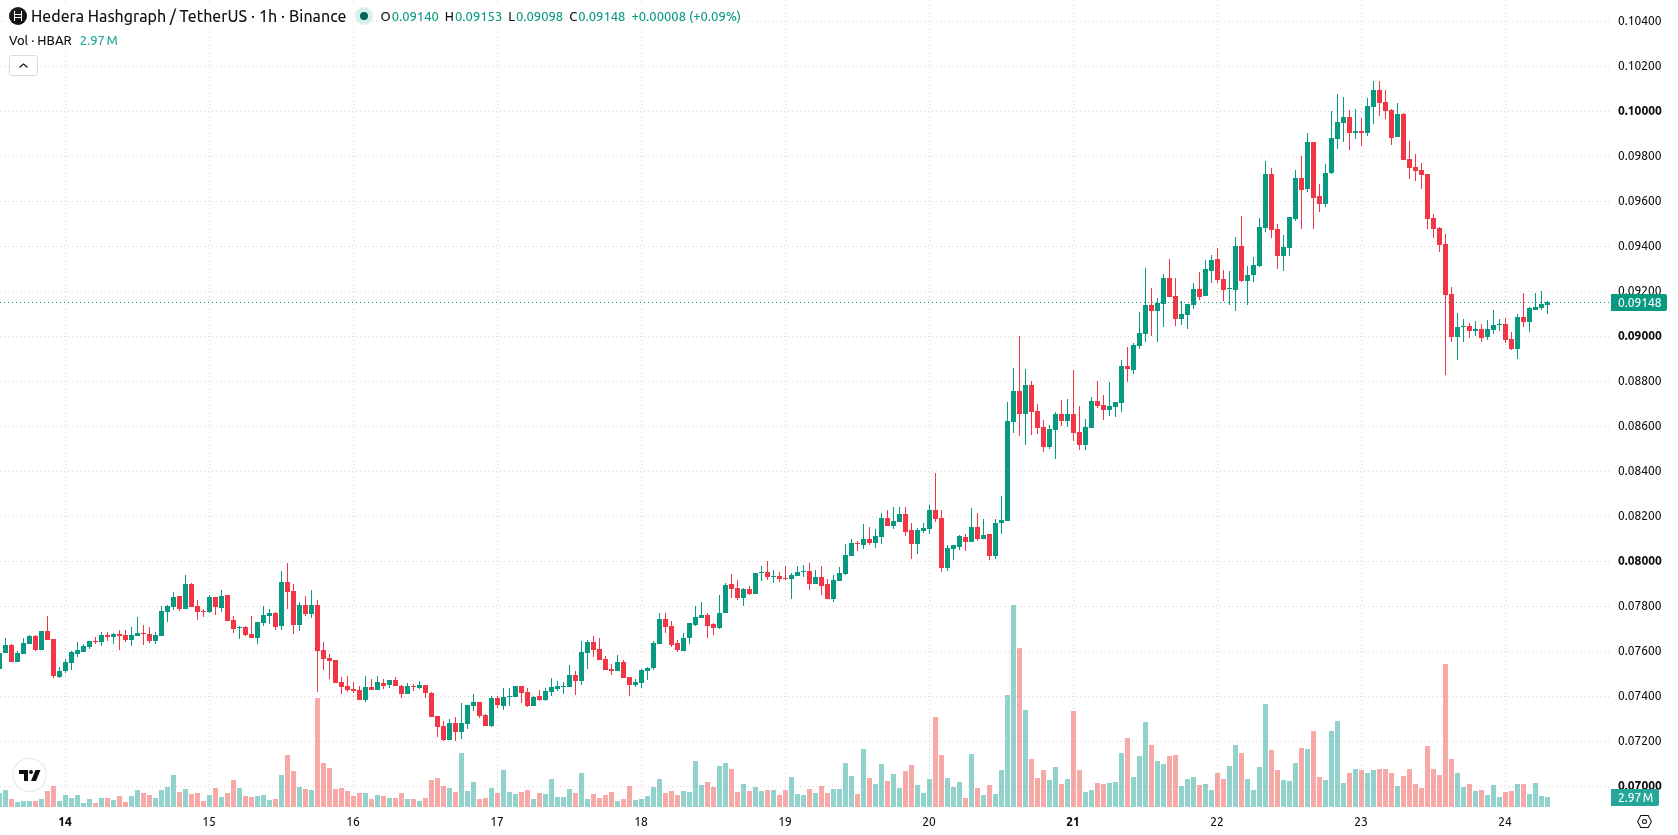
Mixed momentum as conflicting indicators meet key resistance
On the hourly chart, HBAR/USD is trading above the MA-20 but remains below the MA-50. On the daily timeframe, the pair stays above the MA-200, with the Ichimoku Kijun at $0.0943 forming a notable resistance level. Momentum indicators present mixed signals: MACD indicates strong selling, supported by ADX confirming seller dominance, yet intraday Bull/Bear Power points to robust buying. RSI registers 45.79 (Sell), CCI is Neutral, and Stochastic RSI is Overbought, marking potential short-term exhaustion amid conflicting oscillator and momentum readings.
Directional bias tilts higher as range-bound volatility persists
For the next 2-3 trading days, HBAR/USD is expected to consolidate within a volatility band of $0.0853 to $0.0973. There is a 59% probability of an upward move, while the likelihood of further declines is 41%. If buyers overcome resistance at $0.0943, price could advance toward the upper end of the forecast range; failure to hold support may open the way for a move toward the lower boundary.
Earlier, analysts noted that Hedera’s strong technical momentum and ecosystem growth were expected to provide support despite prevailing selling pressures. The current emergence of enterprise integrations and broadening network use cases adds a new dimension, positioning the $0.0943 resistance as the pivotal threshold for initiating the next significant price move.






Latest HBAR News




-
 Afghanistan
-
 Albania
-
 Algeria
-
 Angola
-
 Argentina
-
 Armenia
-
 Australia
-
 Austria
-
 Azerbaijan
-
 Bahamas
-
 Bahrain
-
 Bangladesh
-
 Belarus
-
 Belgium
-
 Bolivia
-
 Botswana
-
 Brazil
-
 Brunei
-
 Bulgaria
-
 Cambodia
-
 Cameroon
-
 Canada
-
 Chile
-
 China
-
 Colombia
-
 Congo
-
 Costa Rica
-
 Cote d'Ivoire
-
 Croatia
-
 Cuba
-
 Cyprus
-
 Czechia
-
 DR Congo
-
 Denmark
-
 Dominican Republic
-
 Ecuador
-
 Egypt
-
 El Salvador
-
 Estonia
-
 Eswatini
-
 Ethiopia
-
 Finland
-
 France
-
 Georgia
-
 Germany
-
 Ghana
-
 Greece
-
 Haiti
-
 Hong Kong
-
 Hungary
-
 India
-
 Indonesia
-
 Iran, Islamic republic
-
 Iraq
-
 Ireland
-
 Israel
-
 Italy
-
 Jamaica
-
 Japan
-
 Jordan
-
 Kazakhstan
-
 Kenya
-
 Korea
-
 Kuwait
-
 Kyrgyzstan
-
 Laos
-
 Latvia
-
 Lebanon
-
 Lesotho
-
 Libya
-
 Lithuania
-
 Luxembourg
-
 Madagascar
-
 Malaysia
-
 Malta
-
 Mauritius
-
 Mexico
-
 Moldova
-
 Mongolia
-
 Montenegro
-
 Morocco
-
 Mozambique
-
 Myanmar
-
 Namibia
-
 Nepal
-
 Netherlands
-
 New Zealand
-
 Nigeria
-
 North Macedonia
-
 Norway
-
 Oman
-
 Pakistan
-
 Palestine
-
 Panama
-
 Papua New Guinea
-
 Paraguay
-
 Peru
-
 Philippines
-
 Poland
-
 Portugal
-
 Puerto Rico
-
 Qatar
-
 Reunion
-
 Romania
-
 Rwanda
-
 Saudi Arabia
-
 Serbia
-
 Singapore
-
 Slovakia
-
 Slovenia
-
 Somalia
-
 South Africa
-
 Spain
-
 Sri Lanka
-
 Sweden
-
 Switzerland
-
 Syria
-
 Taiwan
-
 Tajikistan
-
 Tanzania
-
 Thailand
-
 Trinidad and Tobago
-
 Tunisia
-
 Turkey
-
 UAE
-
 Uganda
-
 Ukraine
-
 United Kingdom
-
United States
-
 Uruguay
-
 Uzbekistan
-
 Venezuela
-
 Vietnam
-
 Yemen
-
 Zambia
-
 Zimbabwe
- Forex
- Crypto












