

The Graph technical analysis: Rebound underscores bullish short-term momentum

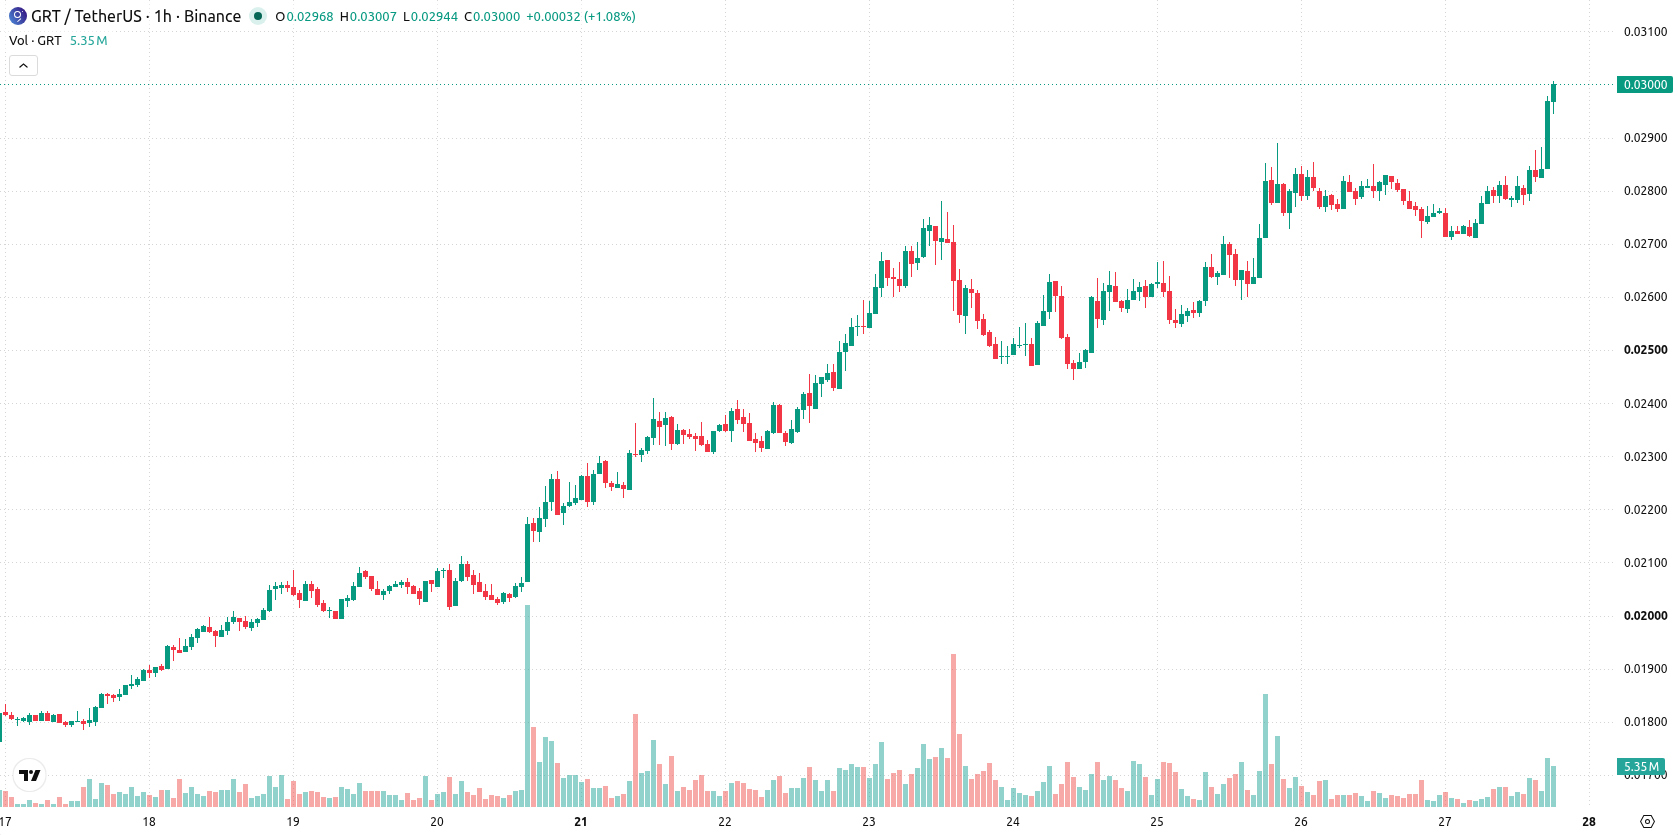
The Graph (GRT) is trading at $0.02996, higher by 7.89% on the day. The price sits above its key moving averages, indicating short-term upward momentum.
 0.01905
0.02108000
Highlights
- GRT/USD remains in a strong bullish trend, trading well above short and medium-term moving averages and near the day high.
- Momentum indicators including MACD and ADX confirm ongoing buyer control, though intraday oscillators are overbought and suggest retracement risk.
- Price is up 7.89% at $0.02996, with support at $0.027955 and an expected two to three day range of $0.02842606 to $0.03149394.
Bullish momentum with overbought risks at key technical barriers
On the technical front, GRT/USD is trading above the MA-20 and MA-50 on the hourly chart, while maintaining a clear margin above the MA-200 on the daily timeframe. The Ichimoku Kijun serves as immediate support at $0.027955. MACD and ADX both signal robust bullish momentum, with Bull/Bear Power indicating strong buyer control throughout the session. However, RSI and CCI are in overbought territory, and Stoch RSI also points to intraday overbought conditions, suggesting upside may be capped in the short term. The Awesome Oscillator offers additional confirmation of upward bias, supporting the session's buying pressure.
High probability of consolidation as overbought signals build
Looking ahead, the next 2–3 trading days are likely to see GRT/USD fluctuating within a range of $0.02842606 to $0.03149394, with upside probability assessed as very high. The baseline expectation is for price to consolidate between immediate support and recent highs, although a decisive breakout above resistance could prompt retests of the upper forecast boundary. Should the price fall below the Ichimoku Kijun, a swift short-term retracement may develop as overbought conditions resolve.
Earlier, analysts noted that The Graph was maintaining its upward trend, with technical signals suggesting the potential for ongoing gains. The latest analysis confirms this bullish outlook, though current overbought conditions highlight the importance of monitoring for a breakout or a swift retracement if support at the Ichimoku Kijun fails.











-
 Afghanistan
-
 Albania
-
 Algeria
-
 Angola
-
 Argentina
-
 Armenia
-
 Australia
-
 Austria
-
 Azerbaijan
-
 Bahamas
-
 Bahrain
-
 Bangladesh
-
 Belarus
-
 Belgium
-
 Bolivia
-
 Botswana
-
 Brazil
-
 Brunei
-
 Bulgaria
-
 Cambodia
-
 Cameroon
-
 Canada
-
 Chile
-
 China
-
 Colombia
-
 Congo
-
 Costa Rica
-
 Cote d'Ivoire
-
 Croatia
-
 Cuba
-
 Cyprus
-
 Czechia
-
 DR Congo
-
 Denmark
-
 Dominican Republic
-
 Ecuador
-
 Egypt
-
 El Salvador
-
 Estonia
-
 Eswatini
-
 Ethiopia
-
 Finland
-
 France
-
 Georgia
-
 Germany
-
 Ghana
-
 Greece
-
 Haiti
-
 Hong Kong
-
 Hungary
-
 India
-
 Indonesia
-
 Iran, Islamic republic
-
 Iraq
-
 Ireland
-
 Israel
-
 Italy
-
 Jamaica
-
 Japan
-
 Jordan
-
 Kazakhstan
-
 Kenya
-
 Korea
-
 Kuwait
-
 Kyrgyzstan
-
 Laos
-
 Latvia
-
 Lebanon
-
 Lesotho
-
 Libya
-
 Lithuania
-
 Luxembourg
-
 Madagascar
-
 Malaysia
-
 Malta
-
 Mauritius
-
 Mexico
-
 Moldova
-
 Mongolia
-
 Montenegro
-
 Morocco
-
 Mozambique
-
 Myanmar
-
 Namibia
-
 Nepal
-
 Netherlands
-
 New Zealand
-
 Nigeria
-
 North Macedonia
-
 Norway
-
 Oman
-
 Pakistan
-
 Palestine
-
 Panama
-
 Papua New Guinea
-
 Paraguay
-
 Peru
-
 Philippines
-
 Poland
-
 Portugal
-
 Puerto Rico
-
 Qatar
-
 Reunion
-
 Romania
-
 Rwanda
-
 Saudi Arabia
-
 Serbia
-
 Singapore
-
 Slovakia
-
 Slovenia
-
 Somalia
-
 South Africa
-
 Spain
-
 Sri Lanka
-
 Sweden
-
 Switzerland
-
 Syria
-
 Taiwan
-
 Tajikistan
-
 Tanzania
-
 Thailand
-
 Trinidad and Tobago
-
 Tunisia
-
 Turkey
-
 UAE
-
 Uganda
-
 Ukraine
-
 United Kingdom
-
United States
-
 Uruguay
-
 Uzbekistan
-
 Venezuela
-
 Vietnam
-
 Yemen
-
 Zambia
-
 Zimbabwe
- Forex
- Crypto












