

Celestia faces resistance at $0.6333 as technicals signal overbought conditions: weekly outlook

Celestia (TIA) surged to near $0.63 this week, advancing by about 35% as institutional momentum accelerated. Robust inflows followed a series of crucial network integrations and upgrades, creating a setup where buyers hold the upper hand — though volatility and technical stretch are in focus looking to the coming week.
 0.6331
0.6333
0.6331
0.6333
Highlights
- Celestia has risen 34.94% in the past week to $0.6258, establishing a strong bullish structure above key averages.
- Momentum indicators show continued strength but overbought conditions may limit further gains as price nears resistance at $0.6333.
- Celestia is forecast to trade between $0.5209 and $0.7306 next week with 77% probability of further gains unless support at $0.4878 breaks.
Major platform integration and fibre rollout fuel sentiment despite operational delays
Derive V3, a major on-chain options platform, integrated TIA as its data availability layer, driving institutional adoption and sparking a notable spike in market activity according to InteractiveCrypto. This development coincided with the rollout of Celestia Fibre architecture, reaching a throughput of 3.07 terabits per second, and the introduction of the Sustainable Blob Economy proposal for network efficiency as reported by TokenPost. Meanwhile, CryptoBriefing noted that Coinbase flagged processing delays for on-chain TIA deposits and withdrawals, although trading and fiat transactions on the exchange remain unaffected.
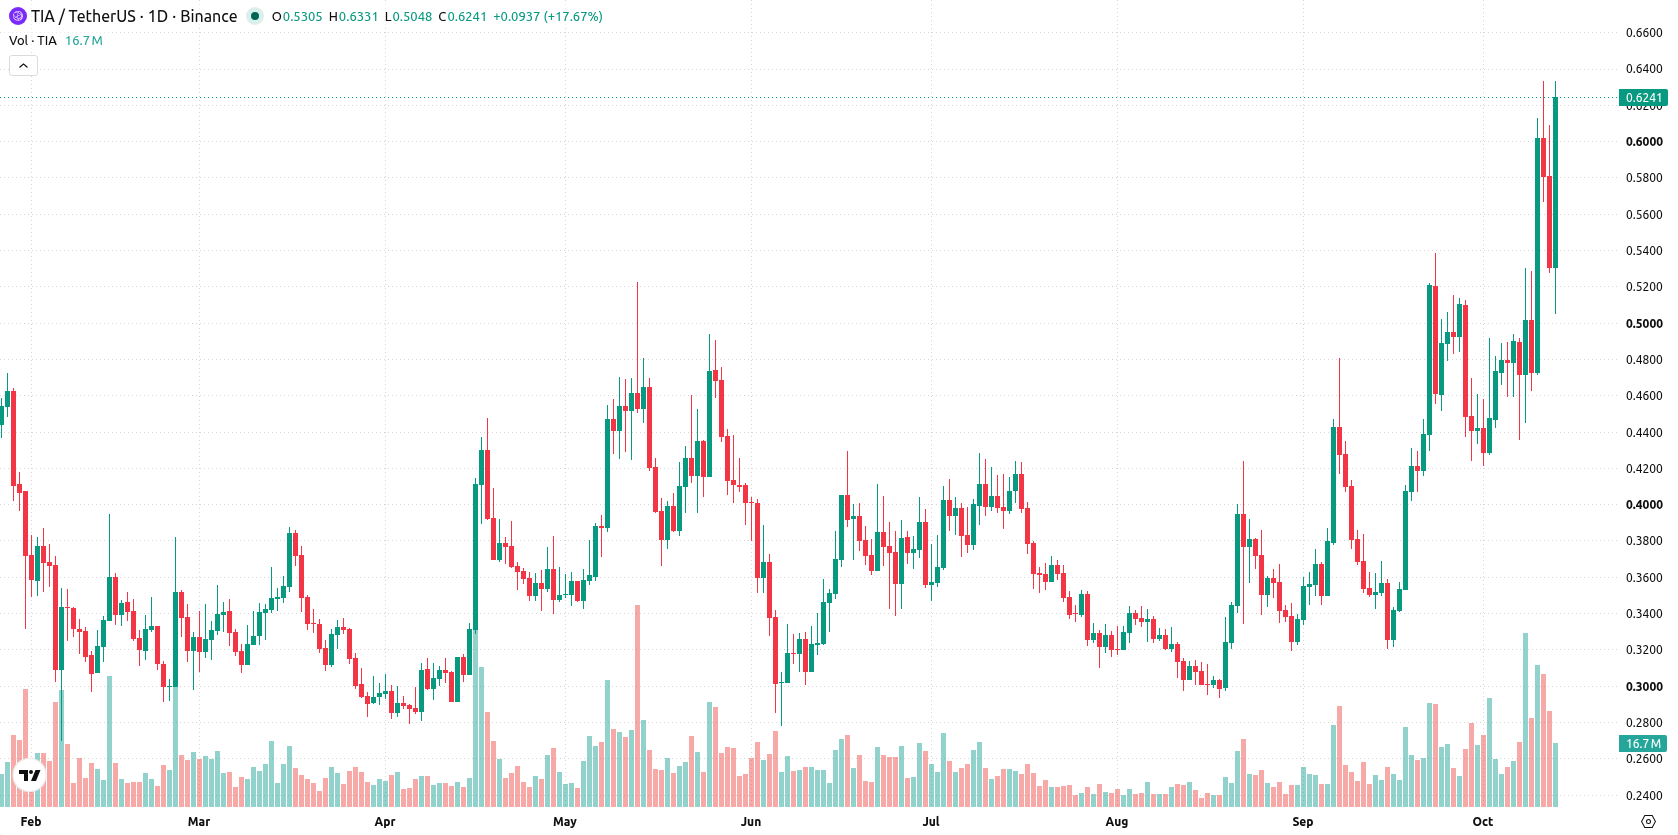
Technical momentum stays strong as CCI and volatility metrics signal overextension
On the daily chart, Celestia shows a sustained move higher with a firm trend, supported by a combination of positive MACD momentum and strong ADX at 30.1308. CCI is already in the overbought zone, which may temper additional upside as the price approaches resistance. The week’s 45.55% volatility highlights the strong range extension. Key support sits at $0.4878, with resistance at $0.6333 as the price tests the top of its recent range.
Bullish breakout odds rise as consolidation range defines next week’s bias
Over the next 7 days, Celestia is expected to trade between $0.5209 and $0.7306. The probability of an increase is 77%, and of a decrease 23%. The base case is for consolidation or a continued advance inside the range, with a bullish breakout scenario above $0.6333 opening room toward the upper end of the forecast. If the price turns lower, a move below support at $0.4878 would shift the bias to the downside.
Earlier, analysts noted that Celestia was facing heightened downside risk amid persistent selling pressure, despite growing adoption and technical advancements. The latest price surge and influx of institutional activity mark a shift in market structure, with $0.6333 now serving as a pivotal resistance level to watch for potential further upside.





Latest Celestia News





-
 Afghanistan
-
 Albania
-
 Algeria
-
 Angola
-
 Argentina
-
 Armenia
-
 Australia
-
 Austria
-
 Azerbaijan
-
 Bahamas
-
 Bahrain
-
 Bangladesh
-
 Belarus
-
 Belgium
-
 Bolivia
-
 Botswana
-
 Brazil
-
 Brunei
-
 Bulgaria
-
 Cambodia
-
 Cameroon
-
 Canada
-
 Chile
Chile
-
 China
China
-
 Colombia
-
 Congo
Congo
-
 Costa Rica
-
 Cote d'Ivoire
-
 Croatia
-
 Cuba
Cuba
-
 Cyprus
-
 Czechia
-
 DR Congo
-
 Denmark
-
 Dominican Republic
-
 Ecuador
-
 Egypt
Egypt
-
 El Salvador
-
 Estonia
-
 Eswatini
-
 Ethiopia
-
 Finland
-
 France
-
 Georgia
-
 Germany
-
 Ghana
Ghana
-
 Greece
-
 Haiti
Haiti
-
 Hong Kong
-
 Hungary
-
 India
India
-
 Indonesia
-
 Iran, Islamic republic
-
 Iraq
Iraq
-
 Ireland
-
 Israel
-
 Italy
Italy
-
 Jamaica
-
 Japan
Japan
-
 Jordan
-
 Kazakhstan
-
 Kenya
Kenya
-
 Korea
Korea
-
 Kuwait
-
 Kyrgyzstan
-
 Laos
Laos
-
 Latvia
-
 Lebanon
-
 Lesotho
-
 Libya
Libya
-
 Lithuania
-
 Luxembourg
-
 Madagascar
-
 Malaysia
-
 Malta
Malta
-
 Mauritius
-
 Mexico
-
 Moldova
-
 Mongolia
-
 Montenegro
-
 Morocco
-
 Mozambique
-
 Myanmar
-
 Namibia
-
 Nepal
Nepal
-
 Netherlands
-
 New Zealand
-
 Nigeria
-
 North Macedonia
-
 Norway
-
 Oman
Oman
-
 Pakistan
-
 Palestine
-
 Panama
-
 Papua New Guinea
-
 Paraguay
-
 Peru
Peru
-
 Philippines
-
 Poland
-
 Portugal
-
 Puerto Rico
-
 Qatar
Qatar
-
 Reunion
-
 Romania
-
 Rwanda
-
 Saudi Arabia
-
 Serbia
-
 Singapore
-
 Slovakia
-
 Slovenia
-
 Somalia
-
 South Africa
-
 Spain
Spain
-
 Sri Lanka
-
 Sweden
-
 Switzerland
-
 Syria
Syria
-
 Taiwan
-
 Tajikistan
-
 Tanzania
-
 Thailand
-
 Trinidad and Tobago
-
 Tunisia
-
 Turkey
-
 UAE
UAE
-
 Uganda
-
 Ukraine
-
 United Kingdom
-
United States
-
 Uruguay
-
 Uzbekistan
-
 Venezuela
-
 Vietnam
-
 Yemen
Yemen
-
 Zambia
-
 Zimbabwe
- Forex
- Crypto












