

Ethena transfer to exchange and investor unlock: ENA remains under pressure

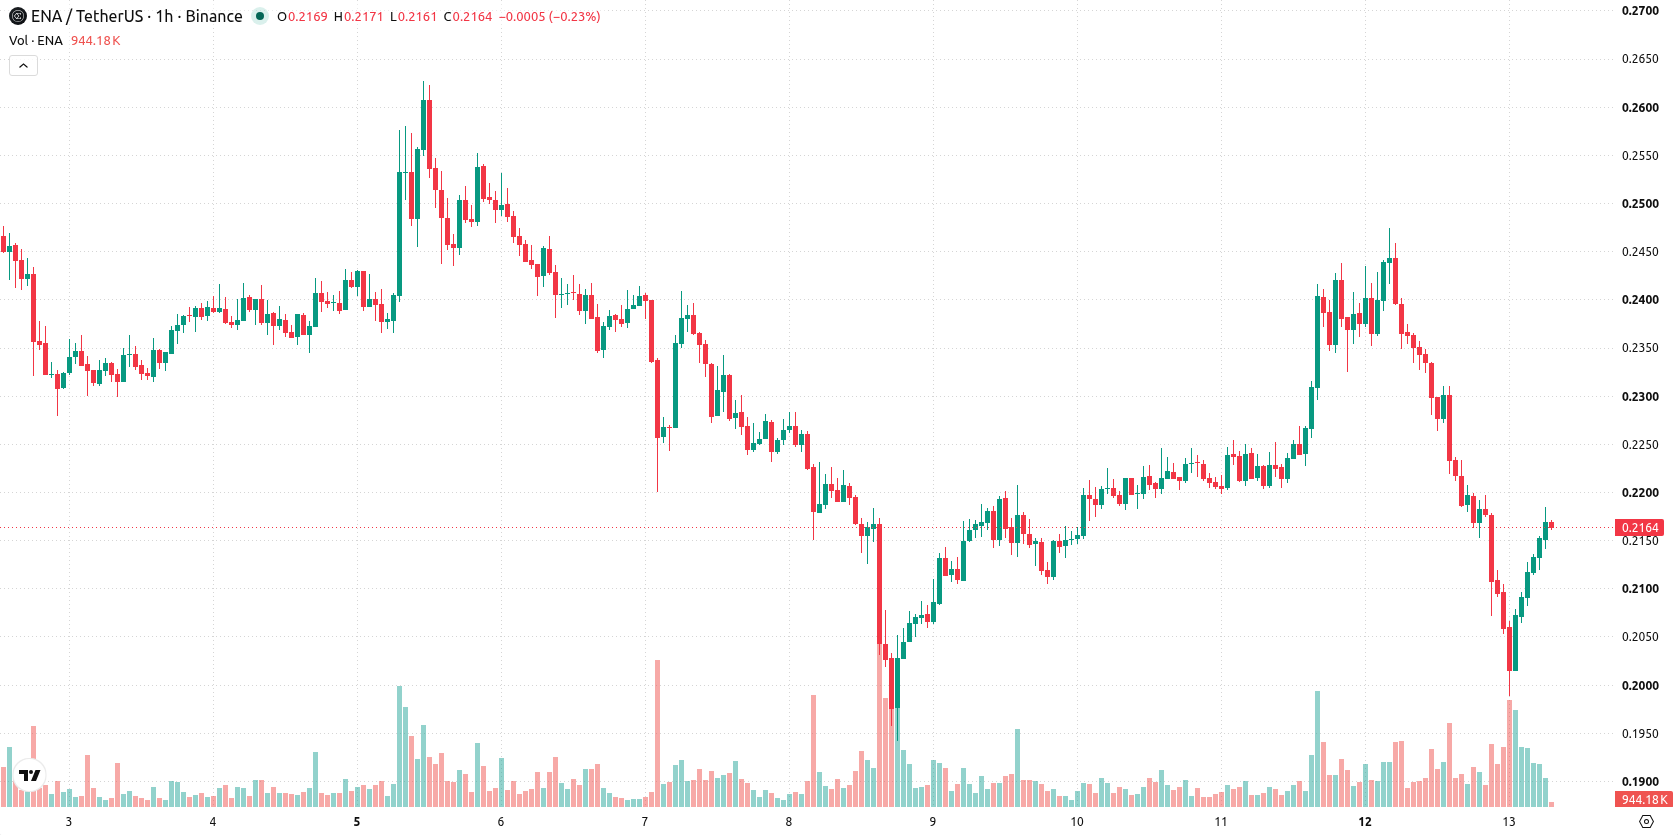
Ethena (ENA) is trading at $0.2168 after falling 8.34% over the past day. The price is positioned below its key short- and medium-term moving averages, but continues to trade above its long-term trend indicator.
 0.2189
0.2474
0.2189
0.2474
Highlights
- $410,000 in ENA long liquidations across major exchanges on October 12, 2026 increased forced selling and downside volatility.
- An accelerated release of original investor ENA allocations and a $2.85 million transfer to Bybit grew circulating supply and available liquidity.
- Short- and medium-term technical signals skew bearish, with ENA expected to trade between $0.2019 and $0.2287 over the next 2 to 3 days.
Long liquidations and token inflows heighten ENA’s downside volatility
A wave of $410,000 in long liquidations across major exchanges including Binance, Bybit, and OKX on October 12, 2026 intensified selling pressure on ENA, leading to forced position closures and amplified downside volatility, according to Tokenpost. The accelerated release of original investor ENA allocations earlier in October facilitated larger liquidity events, potentially increasing the available circulating supply and enabling additional market selling, as reported by Tokenpost. Additionally, a substantial transfer of 11.64 million ENA tokens—valued at $2.85 million—to Bybit from an Ethena Proxy address the same day pointed to further supply entering the market, although the specific intent behind the transaction remained unclear.
Sustained sell signals as resistance holds and buying remains sporadic
Technical analysis on the hourly timeframe shows ENA/USD trading below the MA-20 at $0.217 and MA-50 at $0.2264, while staying above the long-term MA-200 at $0.1189. The Ichimoku Kijun at $0.2231 is currently acting as immediate resistance. Among oscillators, both MACD and ADX indicate prevailing selling pressure, with an RSI reading of 41.8 inside the sell zone; Stoch RSI is currently overbought, and CCI prints a neutral signal. Bull/Bear Power enters buy territory, showing some intraday buyer activity, while the majority of momentum metrics continue to weigh on price direction. The current setup highlights a divergence between the broader downtrend and sporadic intraday buying.
Downside bias as price faces high volatility near resistance
In the short term, ENA/USD is likely to trade between $0.2019 and $0.2287 given recent volatility. There is a 70% probability of a move to the downside, while only a 30% chance is assigned to a sustained upward reversal. The base case is for price to remain within this corridor as high volatility persists. If ENA/USD breaks above $0.2231 resistance, further upside could gain traction; conversely, a consistent drop below $0.2019 would expose the asset to additional downside risk.
Previously it was reported that concentrated token unlocks and profit-taking activities had introduced persistent downside pressure for Ethena, challenging earlier bullish momentum. The latest developments reinforce this cautious outlook, with elevated liquidations and additional supply raising the likelihood of further price weakness; traders should monitor $0.2019 as a critical downside level.





Latest Ethena News





-
 Afghanistan
-
 Albania
-
 Algeria
-
 Angola
-
 Argentina
-
 Armenia
-
 Australia
-
 Austria
-
 Azerbaijan
-
 Bahamas
-
 Bahrain
-
 Bangladesh
-
 Belarus
-
 Belgium
-
 Bolivia
-
 Botswana
-
 Brazil
-
 Brunei
-
 Bulgaria
-
 Cambodia
-
 Cameroon
-
 Canada
-
 Chile
Chile
-
 China
China
-
 Colombia
-
 Congo
Congo
-
 Costa Rica
-
 Cote d'Ivoire
-
 Croatia
-
 Cuba
Cuba
-
 Cyprus
-
 Czechia
-
 DR Congo
-
 Denmark
-
 Dominican Republic
-
 Ecuador
-
 Egypt
Egypt
-
 El Salvador
-
 Estonia
-
 Eswatini
-
 Ethiopia
-
 Finland
-
 France
-
 Georgia
-
 Germany
-
 Ghana
Ghana
-
 Greece
-
 Haiti
Haiti
-
 Hong Kong
-
 Hungary
-
 India
India
-
 Indonesia
-
 Iran, Islamic republic
-
 Iraq
Iraq
-
 Ireland
-
 Israel
-
 Italy
Italy
-
 Jamaica
-
 Japan
Japan
-
 Jordan
-
 Kazakhstan
-
 Kenya
Kenya
-
 Korea
Korea
-
 Kuwait
-
 Kyrgyzstan
-
 Laos
Laos
-
 Latvia
-
 Lebanon
-
 Lesotho
-
 Libya
Libya
-
 Lithuania
-
 Luxembourg
-
 Madagascar
-
 Malaysia
-
 Malta
Malta
-
 Mauritius
-
 Mexico
-
 Moldova
-
 Mongolia
-
 Montenegro
-
 Morocco
-
 Mozambique
-
 Myanmar
-
 Namibia
-
 Nepal
Nepal
-
 Netherlands
-
 New Zealand
-
 Nigeria
-
 North Macedonia
-
 Norway
-
 Oman
Oman
-
 Pakistan
-
 Palestine
-
 Panama
-
 Papua New Guinea
-
 Paraguay
-
 Peru
Peru
-
 Philippines
-
 Poland
-
 Portugal
-
 Puerto Rico
-
 Qatar
Qatar
-
 Reunion
-
 Romania
-
 Rwanda
-
 Saudi Arabia
-
 Serbia
-
 Singapore
-
 Slovakia
-
 Slovenia
-
 Somalia
-
 South Africa
-
 Spain
Spain
-
 Sri Lanka
-
 Sweden
-
 Switzerland
-
 Syria
Syria
-
 Taiwan
-
 Tajikistan
-
 Tanzania
-
 Thailand
-
 Trinidad and Tobago
-
 Tunisia
-
 Turkey
-
 UAE
UAE
-
 Uganda
-
 Ukraine
-
 United Kingdom
-
United States
-
 Uruguay
-
 Uzbekistan
-
 Venezuela
-
 Vietnam
-
 Yemen
Yemen
-
 Zambia
-
 Zimbabwe
- Forex
- Crypto












