

Will RENDER extend its decline amid persistent selling pressure?

Render (RENDER) is trading at $2.005, marking a daily drop of 8.28%. The asset is currently positioned below its key short- and medium-term moving averages, reflecting continued selling momentum.
 2.089
2.2330
2.089
2.2330
Highlights
- Futures open interest in Render increased 12.5% to $74.64 million, showing greater speculative positioning and higher market liquidity.
- Render price remains under broad selling pressure, with recent trading activity introducing more leverage and potential for volatility.
- Technical indicators confirm bearish short-term momentum with price trading near session lows and an expected 2 to 3 day range of $1.813 to $2.1108.
Leveraged flows rise as market adds speculative positions
Futures open interest in Render rose by 12.5%, indicating increased speculative positioning as traders sought greater exposure to the asset, according to Coindcx. This shift introduces more leverage into the market and can amplify price volatility, particularly in combination with broader sentiment swings. Additionally, open interest in Render derivatives has reached $74.64 million, expanding market liquidity and influencing short-term trading dynamics, as reported by Coinedition. These developments have unfolded even as price action has remained under broader selling pressure.
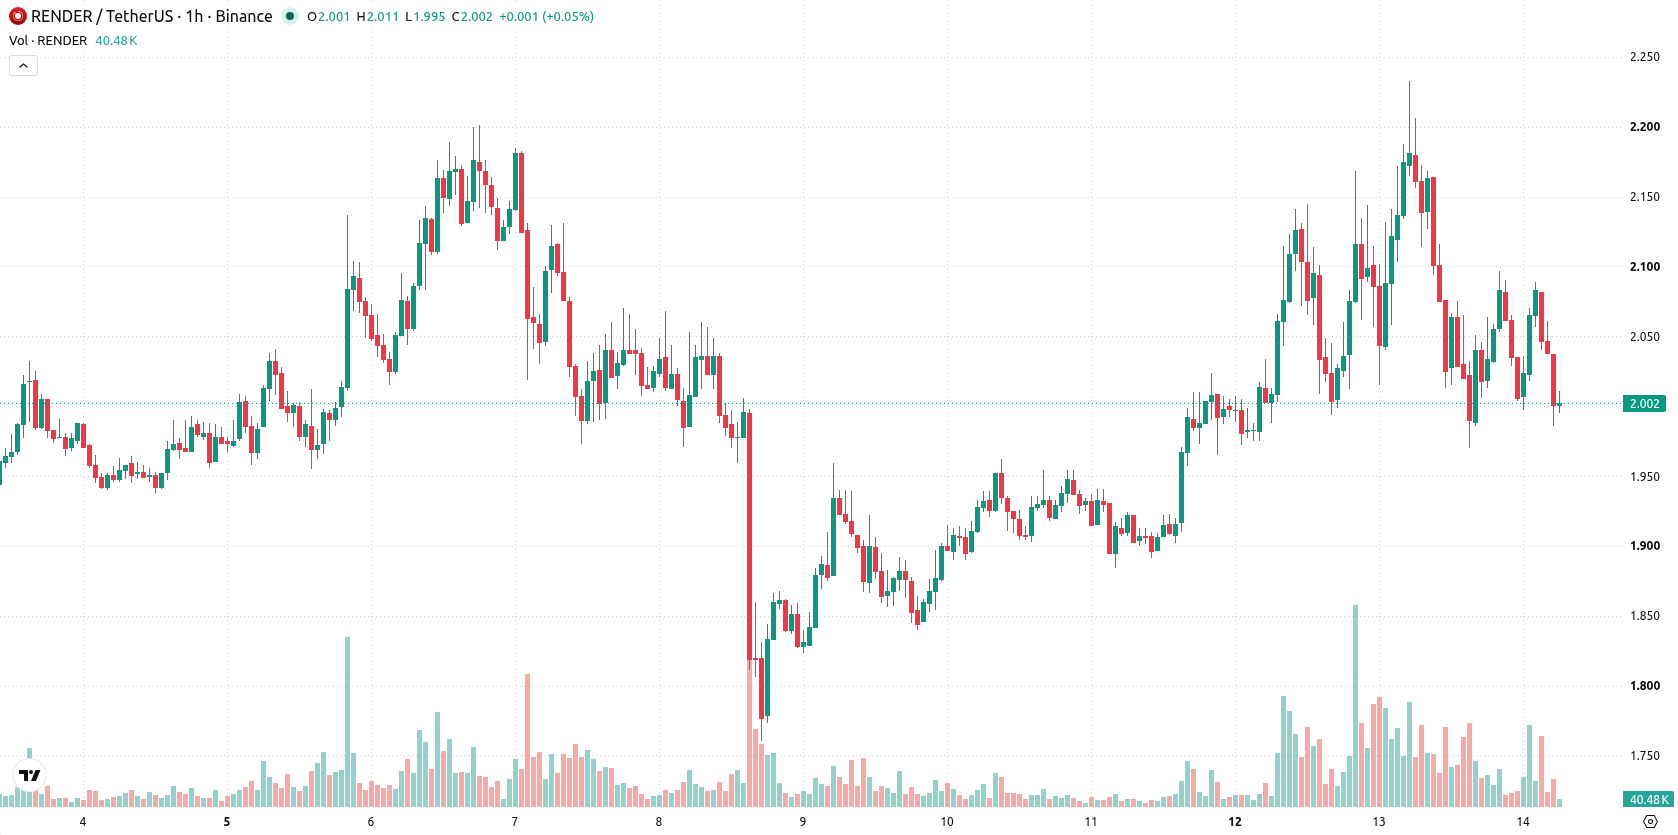
Intraday weakness prevails as sell signals dominate technicals
On the hourly chart, RENDER sits below both its MA-20 and MA-50, signaling the persistence of short- and medium-term weakness. Price action remains well above the daily MA-200, which continues to underpin a constructive longer-term structure. The Ichimoku Kijun at $2.1015 acts as a nearby resistance point. Among indicators, MACD has issued a sell signal, while ADX is neutral; RSI sits at 45, reflecting a sell bias, Stochastic RSI is neutral, and CCI is on sell. Bull/Bear Power also favors sellers, highlighting ongoing intraday downward momentum, while the Awesome Oscillator remains neutral and does not reinforce the prevailing price direction.
Further declines likely as reversal risk stays minimal
Over the next 2–3 trading days, RENDER is likely to fluctuate between $1.813 and $2.1108, in line with recent volatility. There is a very high probability that downside movement will continue, with reversal risk remaining low. The base case scenario expects price consolidation within this range unless a break above resistance at $2.1015 occurs. If the asset fails to hold above $1.813, further selling could accelerate, confirming the near-term bearish scenario.
Earlier, analysts noted that Render’s significant GPU capacity boost and tightening token supply were supporting a bullish technical outlook. However, with the current breakdown below key short-term averages and rising speculative open interest amplifying near-term volatility, traders should closely monitor the $1.813 support as further downside acceleration becomes increasingly likely if this level is lost.





Latest Render News





-
 Afghanistan
-
 Albania
-
 Algeria
-
 Angola
-
 Argentina
-
 Armenia
-
 Australia
-
 Austria
-
 Azerbaijan
-
 Bahamas
-
 Bahrain
-
 Bangladesh
-
 Belarus
-
 Belgium
-
 Bolivia
-
 Botswana
-
 Brazil
-
 Brunei
-
 Bulgaria
-
 Cambodia
-
 Cameroon
-
 Canada
-
 Chile
Chile
-
 China
China
-
 Colombia
-
 Congo
Congo
-
 Costa Rica
-
 Cote d'Ivoire
-
 Croatia
-
 Cuba
Cuba
-
 Cyprus
-
 Czechia
-
 DR Congo
-
 Denmark
-
 Dominican Republic
-
 Ecuador
-
 Egypt
Egypt
-
 El Salvador
-
 Estonia
-
 Eswatini
-
 Ethiopia
-
 Finland
-
 France
-
 Georgia
-
 Germany
-
 Ghana
Ghana
-
 Greece
-
 Haiti
Haiti
-
 Hong Kong
-
 Hungary
-
 India
India
-
 Indonesia
-
 Iran, Islamic republic
-
 Iraq
Iraq
-
 Ireland
-
 Israel
-
 Italy
Italy
-
 Jamaica
-
 Japan
Japan
-
 Jordan
-
 Kazakhstan
-
 Kenya
Kenya
-
 Korea
Korea
-
 Kuwait
-
 Kyrgyzstan
-
 Laos
Laos
-
 Latvia
-
 Lebanon
-
 Lesotho
-
 Libya
Libya
-
 Lithuania
-
 Luxembourg
-
 Madagascar
-
 Malaysia
-
 Malta
Malta
-
 Mauritius
-
 Mexico
-
 Moldova
-
 Mongolia
-
 Montenegro
-
 Morocco
-
 Mozambique
-
 Myanmar
-
 Namibia
-
 Nepal
Nepal
-
 Netherlands
-
 New Zealand
-
 Nigeria
-
 North Macedonia
-
 Norway
-
 Oman
Oman
-
 Pakistan
-
 Palestine
-
 Panama
-
 Papua New Guinea
-
 Paraguay
-
 Peru
Peru
-
 Philippines
-
 Poland
-
 Portugal
-
 Puerto Rico
-
 Qatar
Qatar
-
 Reunion
-
 Romania
-
 Rwanda
-
 Saudi Arabia
-
 Serbia
-
 Singapore
-
 Slovakia
-
 Slovenia
-
 Somalia
-
 South Africa
-
 Spain
Spain
-
 Sri Lanka
-
 Sweden
-
 Switzerland
-
 Syria
Syria
-
 Taiwan
-
 Tajikistan
-
 Tanzania
-
 Thailand
-
 Trinidad and Tobago
-
 Tunisia
-
 Turkey
-
 UAE
UAE
-
 Uganda
-
 Ukraine
-
 United Kingdom
-
United States
-
 Uruguay
-
 Uzbekistan
-
 Venezuela
-
 Vietnam
-
 Yemen
Yemen
-
 Zambia
-
 Zimbabwe
- Forex
- Crypto












