

Celestia technical analysis: Downward price move points to sustained bearish momentum

Celestia (TIA) is trading at $0.5555, reflecting a daily decrease of 11.19%. The asset is positioned below its short- and medium-term moving averages but remains supported above its long-term average.
 0.652
0.7690
Highlights
- Celestia completed an end-to-end Fibre protocol test with average throughput of 3.07 Tb/s in a controlled environment.
- Celestia records $132.2 million in 24-hour trading volume and a market capitalization of $567.59 million, with continued selling pressure.
- TIA trades below key short- and medium-term moving averages with weak momentum, and is expected to remain in a $0.5133 to $0.6175 range with high probability of further downside.
Network throughput milestone offsets by persistent selling pressure
Celestia completed an end-to-end Fibre protocol test achieving an average throughput of 3.07 Tb/s in a controlled environment, according to Square Htx. This technological milestone demonstrates the network's capacity for high data speeds, though it may not translate to immediate changes in market demand. Data from Tokenpost also highlights active participation with a 24-hour trading volume of $132.2 million and a market capitalization of approximately $567.59 million, though price action has remained under broader selling pressure.
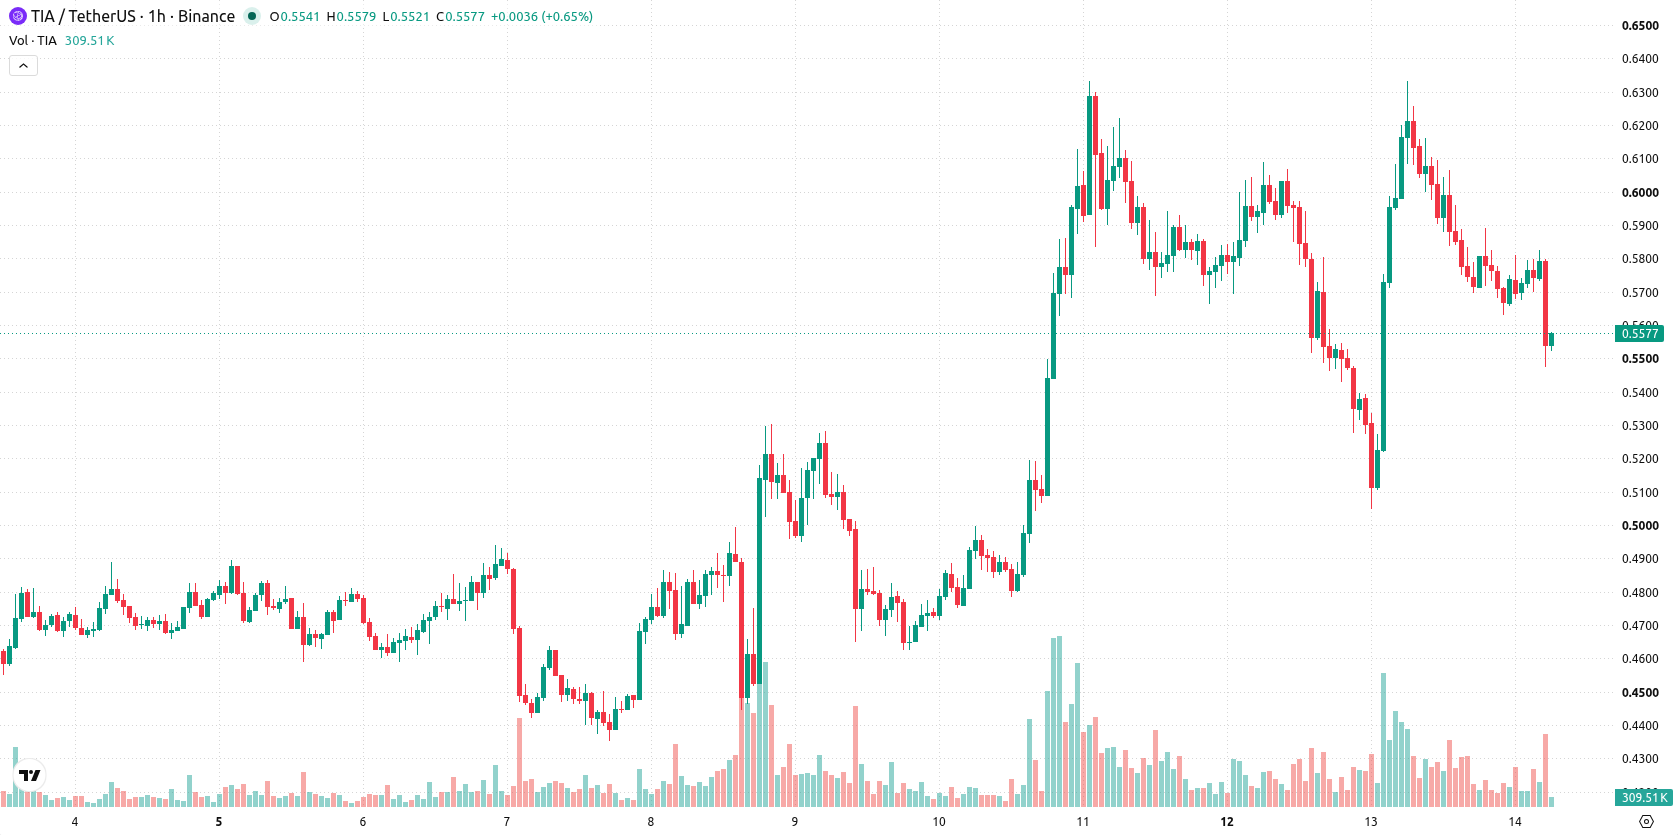
Downside momentum persists amid mixed technical signals
On the H1 timeframe, TIA/USD is trading below the MA-20 and MA-50, reflecting short- and medium-term downside momentum, while remaining above the long-term MA-200, which offers structural support. The Ichimoku Kijun is situated at $0.5981 and serves as immediate resistance. Indicator readings show RSI at 48.48 (Sell signal), MACD also on Sell, and Stoch RSI indicating a Strong Sell, with CCI remaining Neutral and ADX Neutral, suggesting an absence of a defined trend. Bull/Bear Power highlights some ongoing buyer presence even as the price closes near daily lows, indicating a divergence between oscillator signals and intraday sentiment.
Sideways outlook as downside risk outweighs rebound odds
Over the next two to three trading days, TIA is expected to remain within a volatility band between $0.5133 and $0.6175. The likelihood of a meaningful upward move is low, with downside continuation risk remaining high and making a rebound unlikely. The baseline scenario anticipates sideways trading inside this corridor, while a bullish reversal would require a firm break above the Ichimoku Kijun resistance at $0.5981. A bearish extension could occur if price slips below $0.5133, which would confirm further downside.
Earlier, analysts noted that Celestia's short-term upside potential was contingent on navigating operational disruptions and resolving technical resistance. The current article signals a shift to downside risk dominance, with further bearish extension possible if TIA breaks below the $0.5133 support level in the coming days.









-
 Afghanistan
-
 Albania
-
 Algeria
-
 Angola
-
 Argentina
-
 Armenia
-
 Australia
-
 Austria
-
 Azerbaijan
-
 Bahamas
-
 Bahrain
-
 Bangladesh
-
 Belarus
-
 Belgium
-
 Bolivia
-
 Botswana
-
 Brazil
-
 Brunei
-
 Bulgaria
-
 Cambodia
-
 Cameroon
-
 Canada
-
 Chile
-
 China
-
 Colombia
-
 Congo
-
 Costa Rica
-
 Cote d'Ivoire
-
 Croatia
-
 Cuba
-
 Cyprus
-
 Czechia
-
 DR Congo
-
 Denmark
-
 Dominican Republic
-
 Ecuador
-
 Egypt
-
 El Salvador
-
 Estonia
-
 Eswatini
-
 Ethiopia
-
 Finland
-
 France
-
 Georgia
-
 Germany
-
 Ghana
-
 Greece
-
 Haiti
-
 Hong Kong
-
 Hungary
-
 India
-
 Indonesia
-
 Iran, Islamic republic
-
 Iraq
-
 Ireland
-
 Israel
-
 Italy
-
 Jamaica
-
 Japan
-
 Jordan
-
 Kazakhstan
-
 Kenya
-
 Korea
-
 Kuwait
-
 Kyrgyzstan
-
 Laos
-
 Latvia
-
 Lebanon
-
 Lesotho
-
 Libya
-
 Lithuania
-
 Luxembourg
-
 Madagascar
-
 Malaysia
-
 Malta
-
 Mauritius
-
 Mexico
-
 Moldova
-
 Mongolia
-
 Montenegro
-
 Morocco
-
 Mozambique
-
 Myanmar
-
 Namibia
-
 Nepal
-
 Netherlands
-
 New Zealand
-
 Nigeria
-
 North Macedonia
-
 Norway
-
 Oman
-
 Pakistan
-
 Palestine
-
 Panama
-
 Papua New Guinea
-
 Paraguay
-
 Peru
-
 Philippines
-
 Poland
-
 Portugal
-
 Puerto Rico
-
 Qatar
-
 Reunion
-
 Romania
-
 Rwanda
-
 Saudi Arabia
-
 Serbia
-
 Singapore
-
 Slovakia
-
 Slovenia
-
 Somalia
-
 South Africa
-
 Spain
-
 Sri Lanka
-
 Sweden
-
 Switzerland
-
 Syria
-
 Taiwan
-
 Tajikistan
-
 Tanzania
-
 Thailand
-
 Trinidad and Tobago
-
 Tunisia
-
 Turkey
-
 UAE
-
 Uganda
-
 Ukraine
-
 United Kingdom
-
United States
-
 Uruguay
-
 Uzbekistan
-
 Venezuela
-
 Vietnam
-
 Yemen
-
 Zambia
-
 Zimbabwe
- Forex
- Crypto












