

RAY slides over 10% as technical momentum turns negative with oversold signals

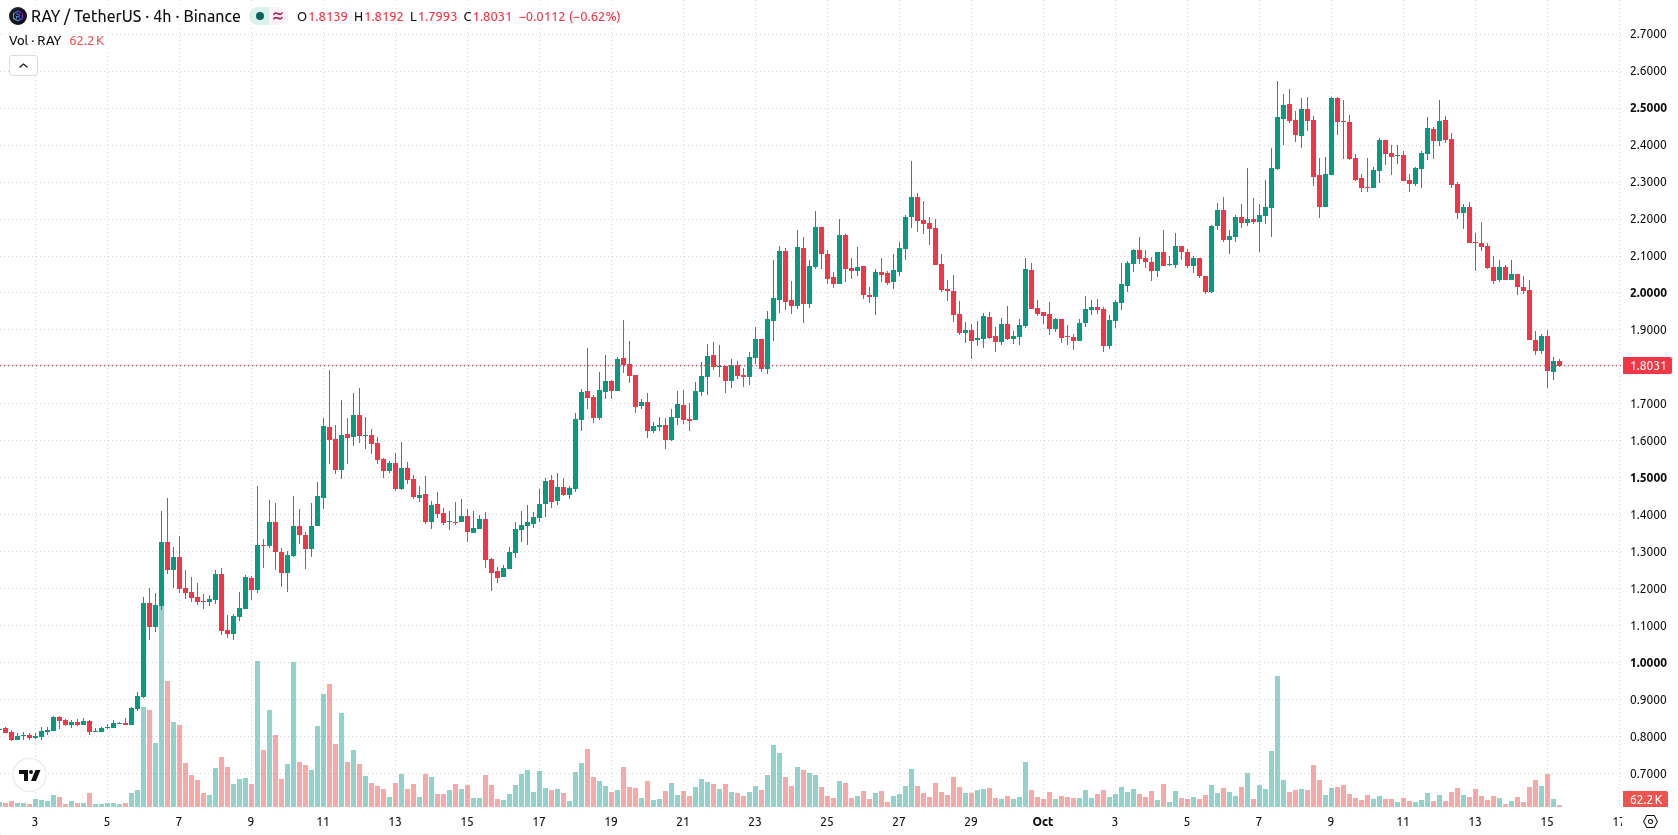
Raydium (RAY) fell 10.33% as increased selling pressure was evident amid muted corporate news flow. The move is limited, with RAY trading below its 20-day moving average but still above the longer-term 50-day and 200-day levels.
 1.8418
2.5199
1.8418
2.5199
Highlights
- Raydium token trading volume fell sharply on October 14, 2026 compared to its monthly average, with no reported regulatory or protocol events.
- Ongoing broad-based selling pressure has persisted in Raydium, suggesting sector rotation or asset-specific sales may be influencing flows.
- RAY/USD is experiencing short-term downside momentum within a bullish medium-term setup, with a five-day range of $1.4551 to $2.1527 and technical indicators showing oversold conditions.
Low trading volume underscores sector rotation as selling persists
On October 14, 2026, the Raydium token experienced a sharp decline in trading volume compared to the monthly average. No specific regulatory actions or protocol incidents were reported in connection with Raydium. The movement may be related to sector rotation or asset-specific sales, though price action has remained under broader selling pressure.
Mixed momentum signals as RAY holds long-term support
RAY/USD is currently positioned below the 20-day moving average at $2.1173, but remains above the 50-day ($1.6132) and 200-day ($0.91) averages. This setup signals near-term weakness in price action, balanced against a medium- and long-term bullish trend. The immediate resistance sits at $1.8313, while near-term support is established at $1.7424. Momentum readings are mixed: MACD issues a strong buy signal and ADX confirms trend strength, but RSI sits in sell territory at 45.407. Oscillators underline the oversold condition, with Stochastic RSI fully depleted at 0, CCI at -93.90, and BBP mildly negative at -0.0374, matching the persistent selling pressure observed intraday.
Previously it was reported that Raydium was experiencing short-term selling pressure while maintaining an overall bullish medium- and long-term structure. Latest trading data reinforce this view, highlighting that price action remains volatile within a consolidating range and making the $1.7424 support level a key threshold to monitor in the days ahead.





Latest Raydium News





-
 Afghanistan
-
 Albania
-
 Algeria
-
 Angola
-
 Argentina
-
 Armenia
-
 Australia
-
 Austria
-
 Azerbaijan
-
 Bahamas
-
 Bahrain
-
 Bangladesh
-
 Belarus
-
 Belgium
-
 Bolivia
-
 Botswana
-
 Brazil
-
 Brunei
-
 Bulgaria
-
 Cambodia
-
 Cameroon
-
 Canada
-
 Chile
Chile
-
 China
China
-
 Colombia
-
 Congo
Congo
-
 Costa Rica
-
 Cote d'Ivoire
-
 Croatia
-
 Cuba
Cuba
-
 Cyprus
-
 Czechia
-
 DR Congo
-
 Denmark
-
 Dominican Republic
-
 Ecuador
-
 Egypt
Egypt
-
 El Salvador
-
 Estonia
-
 Eswatini
-
 Ethiopia
-
 Finland
-
 France
-
 Georgia
-
 Germany
-
 Ghana
Ghana
-
 Greece
-
 Haiti
Haiti
-
 Hong Kong
-
 Hungary
-
 India
India
-
 Indonesia
-
 Iran, Islamic republic
-
 Iraq
Iraq
-
 Ireland
-
 Israel
-
 Italy
Italy
-
 Jamaica
-
 Japan
Japan
-
 Jordan
-
 Kazakhstan
-
 Kenya
Kenya
-
 Korea
Korea
-
 Kuwait
-
 Kyrgyzstan
-
 Laos
Laos
-
 Latvia
-
 Lebanon
-
 Lesotho
-
 Libya
Libya
-
 Lithuania
-
 Luxembourg
-
 Madagascar
-
 Malaysia
-
 Malta
Malta
-
 Mauritius
-
 Mexico
-
 Moldova
-
 Mongolia
-
 Montenegro
-
 Morocco
-
 Mozambique
-
 Myanmar
-
 Namibia
-
 Nepal
Nepal
-
 Netherlands
-
 New Zealand
-
 Nigeria
-
 North Macedonia
-
 Norway
-
 Oman
Oman
-
 Pakistan
-
 Palestine
-
 Panama
-
 Papua New Guinea
-
 Paraguay
-
 Peru
Peru
-
 Philippines
-
 Poland
-
 Portugal
-
 Puerto Rico
-
 Qatar
Qatar
-
 Reunion
-
 Romania
-
 Rwanda
-
 Saudi Arabia
-
 Serbia
-
 Singapore
-
 Slovakia
-
 Slovenia
-
 Somalia
-
 South Africa
-
 Spain
Spain
-
 Sri Lanka
-
 Sweden
-
 Switzerland
-
 Syria
Syria
-
 Taiwan
-
 Tajikistan
-
 Tanzania
-
 Thailand
-
 Trinidad and Tobago
-
 Tunisia
-
 Turkey
-
 UAE
UAE
-
 Uganda
-
 Ukraine
-
 United Kingdom
-
United States
-
 Uruguay
-
 Uzbekistan
-
 Venezuela
-
 Vietnam
-
 Yemen
Yemen
-
 Zambia
-
 Zimbabwe
- Forex
- Crypto












