

Avalanche remains defensive as price action stays capped below $10.67 resistance: weekly outlook

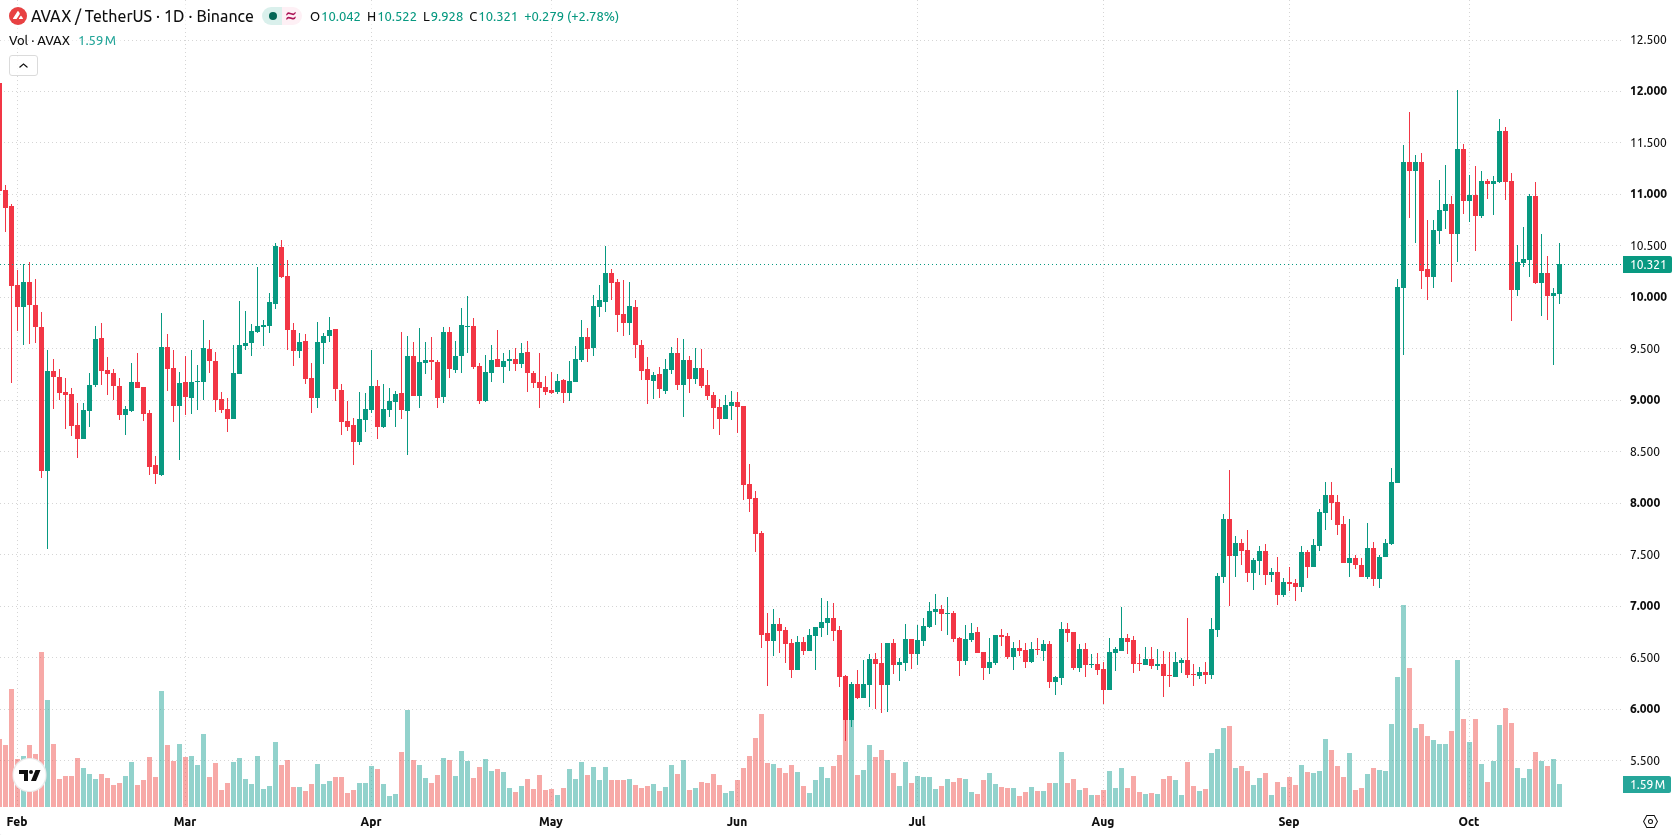
Institutional momentum remains the key theme as Avalanche (AVAX) holds near $10.33, with trading activity reflecting a persistent decline that has stretched into oversold territory. With ecosystem advances and growing adoption from major financial players, attention turns to whether these institutional drivers can help stabilize AVAX or spark a technical rebound in the coming week.
 8.69
9.16
Highlights
- Avalanche trades at $10.33, holding near the midpoint of its weekly range after a minor decline over the past 7 days.
- Indicators are mixed with persistent downward momentum, but both CCI and Stochastic RSI remain in oversold territory, suggesting rebound potential.
- AVAX/USD is expected to fluctuate between $9.34 support and $10.67 resistance, with a 64% probability of an increase over the next week.
Tokenized asset flows accelerate as South Korean infrastructure build boosts institutional interest
The Korean Securities Depository is building infrastructure connections using Avalanche for South Korea's tokenized securities market, with regulatory shifts slated for February 2027, according to ChainCatcher. Over the past week, the chain also saw a notable influx of tokenized assets and $266 million in real-world asset growth, helped along by the Helicon upgrade, as reported by CryptoBriefing. Previous institutional adoption continued to echo, with BlackRock having selected Avalanche for a tokenized fund in November 2024, highlighting continued interest from major financial players, according to 24/7 Wall St.
Oversold signals intensify as CCI and Stochastic RSI diverge from bullish MACD
Daily chart signals present a mixed setup: the trend is firm with a sustained move lower, while CCI and Stochastic RSI are both firmly in the oversold zone (CCI at -165.19, Stochastic RSI at 1.82), but MACD continues to point higher with a "Strong Buy" signal. Volatility remains elevated at 19.06%. Immediate support sits at $9.34, with resistance at $10.67 marked by the Ichimoku Kijun. This combination suggests underlying pressure, but also the potential for an oversold rebound in the coming sessions.
Upside risk grows next week as support and resistance levels define trading range
Over the next 7 days, AVAX/USD is expected to trade within a $9.38 to $12.39 range. The probability of an increase is 64%, while the chance of a decrease stands at 36%. The base case is for price action to continue fluctuating between $9.34 support and $10.67 resistance. A close above $10.67 could open the path toward the upper end of the range, while a break below $9.34 would likely trigger additional downside momentum.
Previously it was reported that Avalanche exhibited strong technical momentum supported by rising derivatives activity and key support levels. The current analysis adds the dimension of sustained institutional adoption and ecosystem growth, highlighting the need to monitor the $10.67 resistance as a potential inflection point for any technical rebound in the days ahead.






Latest Avalanche News





-
 Afghanistan
-
 Albania
-
 Algeria
-
 Angola
-
 Argentina
-
 Armenia
-
 Australia
-
 Austria
-
 Azerbaijan
-
 Bahamas
-
 Bahrain
-
 Bangladesh
-
 Belarus
-
 Belgium
-
 Bolivia
-
 Botswana
-
 Brazil
-
 Brunei
-
 Bulgaria
-
 Cambodia
-
 Cameroon
-
 Canada
-
 Chile
-
 China
-
 Colombia
-
 Congo
-
 Costa Rica
-
 Cote d'Ivoire
-
 Croatia
-
 Cuba
-
 Cyprus
-
 Czechia
-
 DR Congo
-
 Denmark
-
 Dominican Republic
-
 Ecuador
-
 Egypt
-
 El Salvador
-
 Estonia
-
 Eswatini
-
 Ethiopia
-
 Finland
-
 France
-
 Georgia
-
 Germany
-
 Ghana
-
 Greece
-
 Haiti
-
 Hong Kong
-
 Hungary
-
 India
-
 Indonesia
-
 Iran, Islamic republic
-
 Iraq
-
 Ireland
-
 Israel
-
 Italy
-
 Jamaica
-
 Japan
-
 Jordan
-
 Kazakhstan
-
 Kenya
-
 Korea
-
 Kuwait
-
 Kyrgyzstan
-
 Laos
-
 Latvia
-
 Lebanon
-
 Lesotho
-
 Libya
-
 Lithuania
-
 Luxembourg
-
 Madagascar
-
 Malaysia
-
 Malta
-
 Mauritius
-
 Mexico
-
 Moldova
-
 Mongolia
-
 Montenegro
-
 Morocco
-
 Mozambique
-
 Myanmar
-
 Namibia
-
 Nepal
-
 Netherlands
-
 New Zealand
-
 Nigeria
-
 North Macedonia
-
 Norway
-
 Oman
-
 Pakistan
-
 Palestine
-
 Panama
-
 Papua New Guinea
-
 Paraguay
-
 Peru
-
 Philippines
-
 Poland
-
 Portugal
-
 Puerto Rico
-
 Qatar
-
 Reunion
-
 Romania
-
 Rwanda
-
 Saudi Arabia
-
 Serbia
-
 Singapore
-
 Slovakia
-
 Slovenia
-
 Somalia
-
 South Africa
-
 Spain
-
 Sri Lanka
-
 Sweden
-
 Switzerland
-
 Syria
-
 Taiwan
-
 Tajikistan
-
 Tanzania
-
 Thailand
-
 Trinidad and Tobago
-
 Tunisia
-
 Turkey
-
 UAE
-
 Uganda
-
 Ukraine
-
 United Kingdom
-
United States
-
 Uruguay
-
 Uzbekistan
-
 Venezuela
-
 Vietnam
-
 Yemen
-
 Zambia
-
 Zimbabwe
- Forex
- Crypto












