

Polygon slides nearly 4% as MACD and ADX signal continued selling: weekly analysis

Polygon (POL, formerly MATIC) is oscillating near $0.09 after sliding roughly 4% over the past week as buyers struggle to regain control. Despite some renewed efforts by the bulls, the technical picture points to continued volatility and a lack of clear upward momentum. Traders will be watching closely to see if selling pressure remains the dominant force in the days ahead.
 0.0923
0.0965
Highlights
- Polygon price fell 3.79% in the past week to $0.0925, with volatile trading and downside pressure dominating.
- Technical signals remain negative as the asset trades below both short- and medium-term averages, while indicators show persistent sell conditions.
- POL/USD is expected to trade between $0.0777 and $0.0967 over the next 7 days, with resistance at $0.095 and a 67% probability of further decline.
Acquisition and staking moves drive sentiment amid stablecoin payments expansion
Polygon Labs completed the acquisition of Coinme, a regulated U.S. money transmitter, giving POL access to key financial licenses and enhancing its competitive stance in the stablecoin payments sector, according to Bit2Me News. The company also rolled out the Miden partner mainnet, which now integrates with Polygon's Agglayer cross-chain aggregation, expanding access to blockchain liquidity as reported by ChainCatcher. In addition, a Polygon multisignature wallet sent approximately 52.9 million POL tokens to a staking contract, as part of plans to support staking rewards.
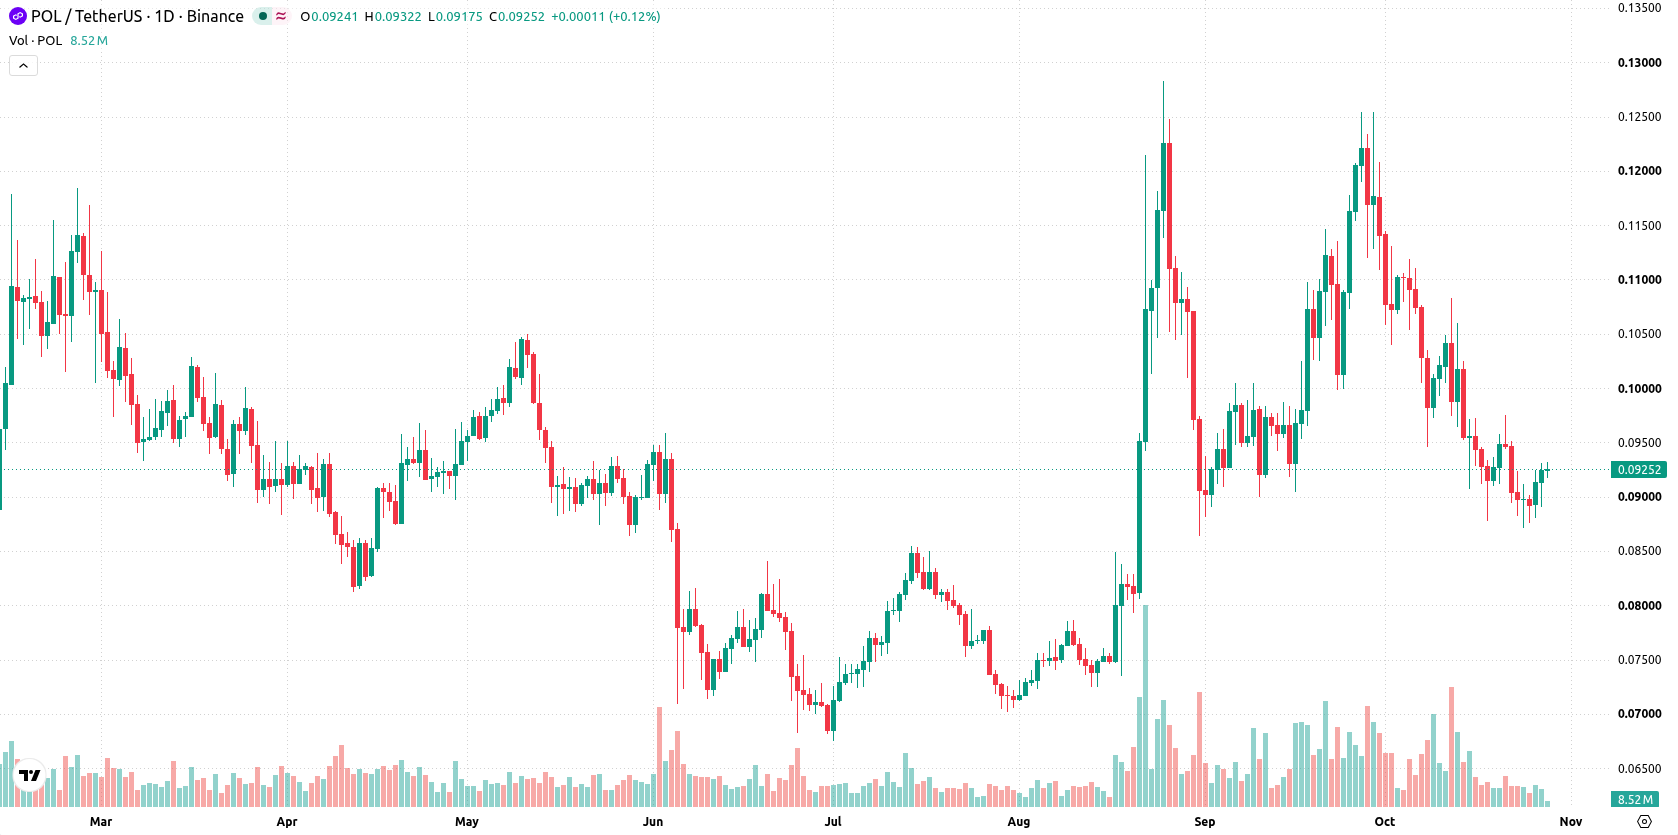
Downside signals strengthen as MACD and ADX affirm bearish momentum this week
On the daily chart, the setup signals a developing trend with a sharp move lower without a sustained trend, as price action remains volatile at 9.3%. MACD and ADX both issue sell signals, pointing to persistent downside pressure, while the Stochastic RSI stands in the overbought zone (89.8497), suggesting possible overheating and correction risk. Key levels to watch are support at $0.0894 (from the MA-200) and resistance at $0.095 (from the MA-20), with the Ichimoku Kijun also offering resistance at $0.1001. Despite holding above long-term support, near-term momentum remains negative.
Downside bias prevails as probability favors range-bound trade below resistance
For the next 7 days, the expected range is $0.0777 to $0.0967, with a 33% probability of price increasing and a 67% probability of a decrease. The base case is for POL/USD to remain capped below resistance at $0.095 and trade between key levels. A move above $0.095 would open the door to a retest of the Ichimoku Kijun at $0.1001. A drop below $0.0894 support could lead to further declines toward the lower end of the expected range.
Previously it was reported that analysts anticipated continued consolidation for Polygon amid persistent downward momentum and key levels under pressure. This outlook is reinforced by the current technical setup, with traders advised to monitor the $0.0894 support as a potential pivot for further downside toward the lower end of the projected range.











-
 Afghanistan
-
 Albania
-
 Algeria
-
 Angola
-
 Argentina
-
 Armenia
-
 Australia
-
 Austria
-
 Azerbaijan
-
 Bahamas
-
 Bahrain
-
 Bangladesh
-
 Belarus
-
 Belgium
-
 Bolivia
-
 Botswana
-
 Brazil
-
 Brunei
-
 Bulgaria
-
 Cambodia
-
 Cameroon
-
 Canada
-
 Chile
-
 China
-
 Colombia
-
 Congo
-
 Costa Rica
-
 Cote d'Ivoire
-
 Croatia
-
 Cuba
-
 Cyprus
-
 Czechia
-
 DR Congo
-
 Denmark
-
 Dominican Republic
-
 Ecuador
-
 Egypt
-
 El Salvador
-
 Estonia
-
 Eswatini
-
 Ethiopia
-
 Finland
-
 France
-
 Georgia
-
 Germany
-
 Ghana
-
 Greece
-
 Haiti
-
 Hong Kong
-
 Hungary
-
 India
-
 Indonesia
-
 Iran, Islamic republic
-
 Iraq
-
 Ireland
-
 Israel
-
 Italy
-
 Jamaica
-
 Japan
-
 Jordan
-
 Kazakhstan
-
 Kenya
-
 Korea
-
 Kuwait
-
 Kyrgyzstan
-
 Laos
-
 Latvia
-
 Lebanon
-
 Lesotho
-
 Libya
-
 Lithuania
-
 Luxembourg
-
 Madagascar
-
 Malaysia
-
 Malta
-
 Mauritius
-
 Mexico
-
 Moldova
-
 Mongolia
-
 Montenegro
-
 Morocco
-
 Mozambique
-
 Myanmar
-
 Namibia
-
 Nepal
-
 Netherlands
-
 New Zealand
-
 Nigeria
-
 North Macedonia
-
 Norway
-
 Oman
-
 Pakistan
-
 Palestine
-
 Panama
-
 Papua New Guinea
-
 Paraguay
-
 Peru
-
 Philippines
-
 Poland
-
 Portugal
-
 Puerto Rico
-
 Qatar
-
 Reunion
-
 Romania
-
 Rwanda
-
 Saudi Arabia
-
 Serbia
-
 Singapore
-
 Slovakia
-
 Slovenia
-
 Somalia
-
 South Africa
-
 Spain
-
 Sri Lanka
-
 Sweden
-
 Switzerland
-
 Syria
-
 Taiwan
-
 Tajikistan
-
 Tanzania
-
 Thailand
-
 Trinidad and Tobago
-
 Tunisia
-
 Turkey
-
 UAE
-
 Uganda
-
 Ukraine
-
 United Kingdom
-
United States
-
 Uruguay
-
 Uzbekistan
-
 Venezuela
-
 Vietnam
-
 Yemen
-
 Zambia
-
 Zimbabwe
- Forex
- Crypto












