

Fetch.ai falls around 10.5% as technical selling pressure and negative momentum weigh on price

Fetch.ai (FET) dropped 10.53% as technical selling pressure and negative momentum drove a broad retreat. The downside move is supported by the persistent lack of bullish momentum, with price action capped below all key moving averages.
 0.126
0.1492
Highlights
- FET/USD trades below short, medium, and long-term moving averages, indicating persistent seller pressure across all timeframes.
- Key technical indicators such as MACD, RSI, Stochastic RSI, and CCI show mild oversold conditions with lackluster trend strength.
- FET/USD is expected to move between $0.1487 to $0.1759 over the next five days, with over 80% probability of further downside.
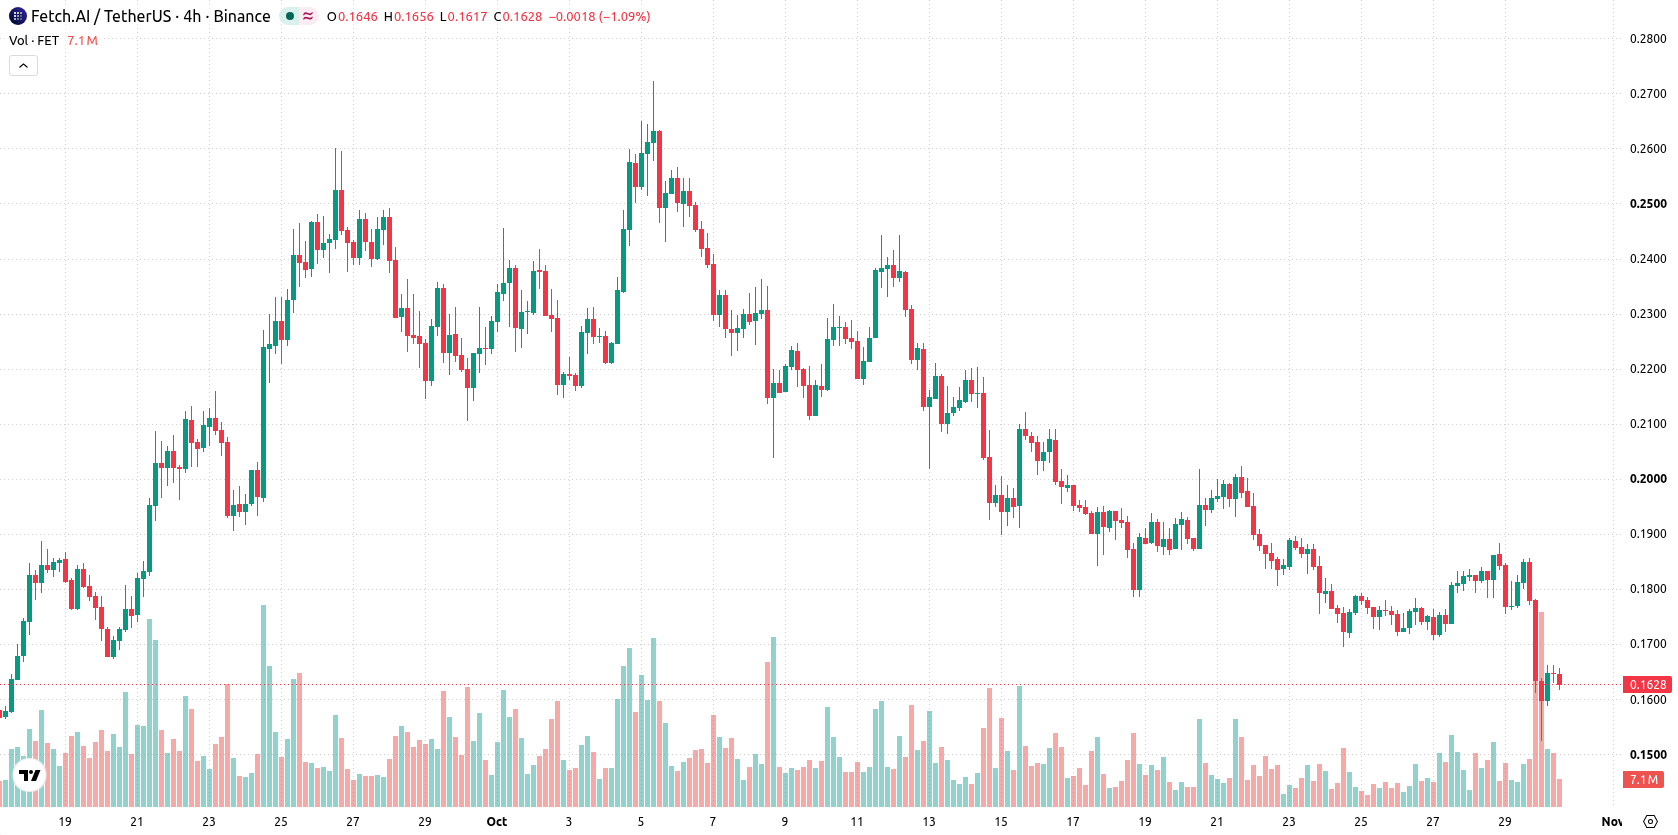
Sustained seller dominance as negative momentum tests mild oversold zone
FET/USD is trading below its 20-day, 50-day, and 200-day moving averages, with current levels at $0.1623 compared to $0.1948, $0.2015, and $0.1879 respectively. Seller pressure persists across short, medium, and long timeframes, though the bullish alignment between the 50-day and 200-day moving averages suggests the longer-term upside bias remains technically intact. The immediate resistance stands at $0.1662, with support at the weekly low of $0.1611. Momentum indicators, including the MACD and ADX, reflect negative momentum and lackluster trend strength, while the RSI, Stochastic RSI, and CCI are all in sell territory, pointing to mild oversold conditions. Intraday volatility remains elevated, and negative Bull/Bear Power confirms sellers dominate short-term movements.
Earlier, analysts noted that Fetch.ai faced broad-based selling pressure and a predominantly bearish technical outlook. The current analysis strengthens this view, underscoring the importance of monitoring the $0.1487 support as a potential trigger for further declines in the days ahead.










-
 Afghanistan
-
 Albania
-
 Algeria
-
 Angola
-
 Argentina
-
 Armenia
-
 Australia
-
 Austria
-
 Azerbaijan
-
 Bahamas
-
 Bahrain
-
 Bangladesh
-
 Belarus
-
 Belgium
-
 Bolivia
-
 Botswana
-
 Brazil
-
 Brunei
-
 Bulgaria
-
 Cambodia
-
 Cameroon
-
 Canada
-
 Chile
-
 China
-
 Colombia
-
 Congo
-
 Costa Rica
-
 Cote d'Ivoire
-
 Croatia
-
 Cuba
-
 Cyprus
-
 Czechia
-
 DR Congo
-
 Denmark
-
 Dominican Republic
-
 Ecuador
-
 Egypt
-
 El Salvador
-
 Estonia
-
 Eswatini
-
 Ethiopia
-
 Finland
-
 France
-
 Georgia
-
 Germany
-
 Ghana
-
 Greece
-
 Haiti
-
 Hong Kong
-
 Hungary
-
 India
-
 Indonesia
-
 Iran, Islamic republic
-
 Iraq
-
 Ireland
-
 Israel
-
 Italy
-
 Jamaica
-
 Japan
-
 Jordan
-
 Kazakhstan
-
 Kenya
-
 Korea
-
 Kuwait
-
 Kyrgyzstan
-
 Laos
-
 Latvia
-
 Lebanon
-
 Lesotho
-
 Libya
-
 Lithuania
-
 Luxembourg
-
 Madagascar
-
 Malaysia
-
 Malta
-
 Mauritius
-
 Mexico
-
 Moldova
-
 Mongolia
-
 Montenegro
-
 Morocco
-
 Mozambique
-
 Myanmar
-
 Namibia
-
 Nepal
-
 Netherlands
-
 New Zealand
-
 Nigeria
-
 North Macedonia
-
 Norway
-
 Oman
-
 Pakistan
-
 Palestine
-
 Panama
-
 Papua New Guinea
-
 Paraguay
-
 Peru
-
 Philippines
-
 Poland
-
 Portugal
-
 Puerto Rico
-
 Qatar
-
 Reunion
-
 Romania
-
 Rwanda
-
 Saudi Arabia
-
 Serbia
-
 Singapore
-
 Slovakia
-
 Slovenia
-
 Somalia
-
 South Africa
-
 Spain
-
 Sri Lanka
-
 Sweden
-
 Switzerland
-
 Syria
-
 Taiwan
-
 Tajikistan
-
 Tanzania
-
 Thailand
-
 Trinidad and Tobago
-
 Tunisia
-
 Turkey
-
 UAE
-
 Uganda
-
 Ukraine
-
 United Kingdom
-
United States
-
 Uruguay
-
 Uzbekistan
-
 Venezuela
-
 Vietnam
-
 Yemen
-
 Zambia
-
 Zimbabwe
- Forex
- Crypto












