

Will Sonic avoid a deeper pullback amid high volatility and mixed momentum?

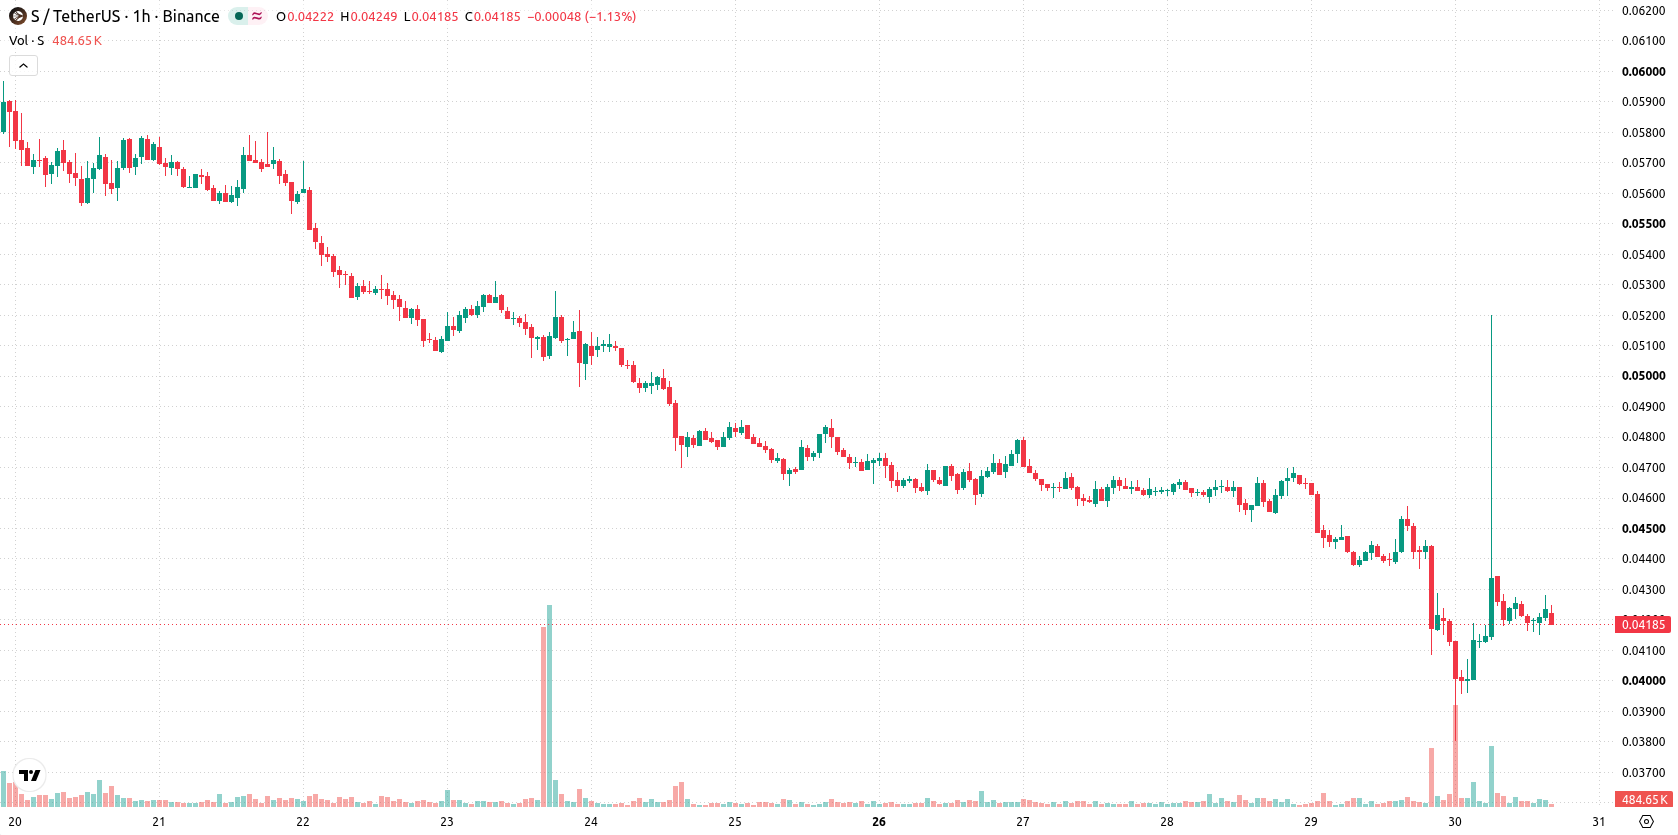
Sonic (S) is trading at $0.042 after falling 7.29% on the day. The price currently sits above its key moving average for the short term, but below the medium-term benchmark, while staying well above long-term trend support.
 0.0398
0.0520
Highlights
- Sonic fell 7.29% on the day to $0.042, trading near today’s low amid elevated intraday volatility.
- Momentum and oscillator readings present mixed signals, indicating short-term indecision and buyer dominance intraday despite prior weakness.
- Expected two to three day price range stands at $0.0393 to $0.0444, with a 57% probability of a further downward move.
Momentum divergence persists as volatility amplifies technical crosscurrents
On the hourly chart, S remains above its MA-20 at $0.0417 but below the MA-50 at $0.0437, with solid long-term support from the MA-200 at $0.0351. The Ichimoku Kijun at $0.045 acts as immediate resistance. Momentum indicators reveal mixed signals: MACD is on a strong sell signal, ADX indicates a buy, and RSI is at 48.78 (Sell), while Stochastic RSI readings indicate overbought conditions. CCI is neutral, and the Awesome Oscillator offers no additional direction. Intraday, Bull/Bear Power highlights notable buyer dominance amid high volatility, but overall, the divergence between momentum and oscillator readings suggests considerable indecision following the day’s sharp decline.
Downside risks outweigh as band trading defines outlook
Looking ahead over the next two to three days, S is projected to fluctuate between $0.0393 and $0.0444, reflecting its recent volatility band. A sustained move above $0.045 would be required to trigger renewed buying momentum, while a close below $0.0393 could confirm a deeper pullback scenario. The probability of an upward breakout is estimated at 43%, with downward continuation seen as slightly more likely at 57%.
Previously it was reported that Sonic faced sustained downside pressure, with technical signals suggesting a continued bearish outlook. The current analysis adds nuance by highlighting increased market indecision and volatility, making a sustained move above $0.045 the key level to monitor for any potential recovery.






Latest Sonic News




-
 Afghanistan
-
 Albania
-
 Algeria
-
 Angola
-
 Argentina
-
 Armenia
-
 Australia
-
 Austria
-
 Azerbaijan
-
 Bahamas
-
 Bahrain
-
 Bangladesh
-
 Belarus
-
 Belgium
-
 Bolivia
-
 Botswana
-
 Brazil
-
 Brunei
-
 Bulgaria
-
 Cambodia
-
 Cameroon
-
 Canada
-
 Chile
-
 China
-
 Colombia
-
 Congo
-
 Costa Rica
-
 Cote d'Ivoire
-
 Croatia
-
 Cuba
-
 Cyprus
-
 Czechia
-
 DR Congo
-
 Denmark
-
 Dominican Republic
-
 Ecuador
-
 Egypt
-
 El Salvador
-
 Estonia
-
 Eswatini
-
 Ethiopia
-
 Finland
-
 France
-
 Georgia
-
 Germany
-
 Ghana
-
 Greece
-
 Haiti
-
 Hong Kong
-
 Hungary
-
 India
-
 Indonesia
-
 Iran, Islamic republic
-
 Iraq
-
 Ireland
-
 Israel
-
 Italy
-
 Jamaica
-
 Japan
-
 Jordan
-
 Kazakhstan
-
 Kenya
-
 Korea
-
 Kuwait
-
 Kyrgyzstan
-
 Laos
-
 Latvia
-
 Lebanon
-
 Lesotho
-
 Libya
-
 Lithuania
-
 Luxembourg
-
 Madagascar
-
 Malaysia
-
 Malta
-
 Mauritius
-
 Mexico
-
 Moldova
-
 Mongolia
-
 Montenegro
-
 Morocco
-
 Mozambique
-
 Myanmar
-
 Namibia
-
 Nepal
-
 Netherlands
-
 New Zealand
-
 Nigeria
-
 North Macedonia
-
 Norway
-
 Oman
-
 Pakistan
-
 Palestine
-
 Panama
-
 Papua New Guinea
-
 Paraguay
-
 Peru
-
 Philippines
-
 Poland
-
 Portugal
-
 Puerto Rico
-
 Qatar
-
 Reunion
-
 Romania
-
 Rwanda
-
 Saudi Arabia
-
 Serbia
-
 Singapore
-
 Slovakia
-
 Slovenia
-
 Somalia
-
 South Africa
-
 Spain
-
 Sri Lanka
-
 Sweden
-
 Switzerland
-
 Syria
-
 Taiwan
-
 Tajikistan
-
 Tanzania
-
 Thailand
-
 Trinidad and Tobago
-
 Tunisia
-
 Turkey
-
 UAE
-
 Uganda
-
 Ukraine
-
 United Kingdom
-
United States
-
 Uruguay
-
 Uzbekistan
-
 Venezuela
-
 Vietnam
-
 Yemen
-
 Zambia
-
 Zimbabwe
- Forex
- Crypto












