

Open Money Stack integration boosts Polygon price amid positive technical signals

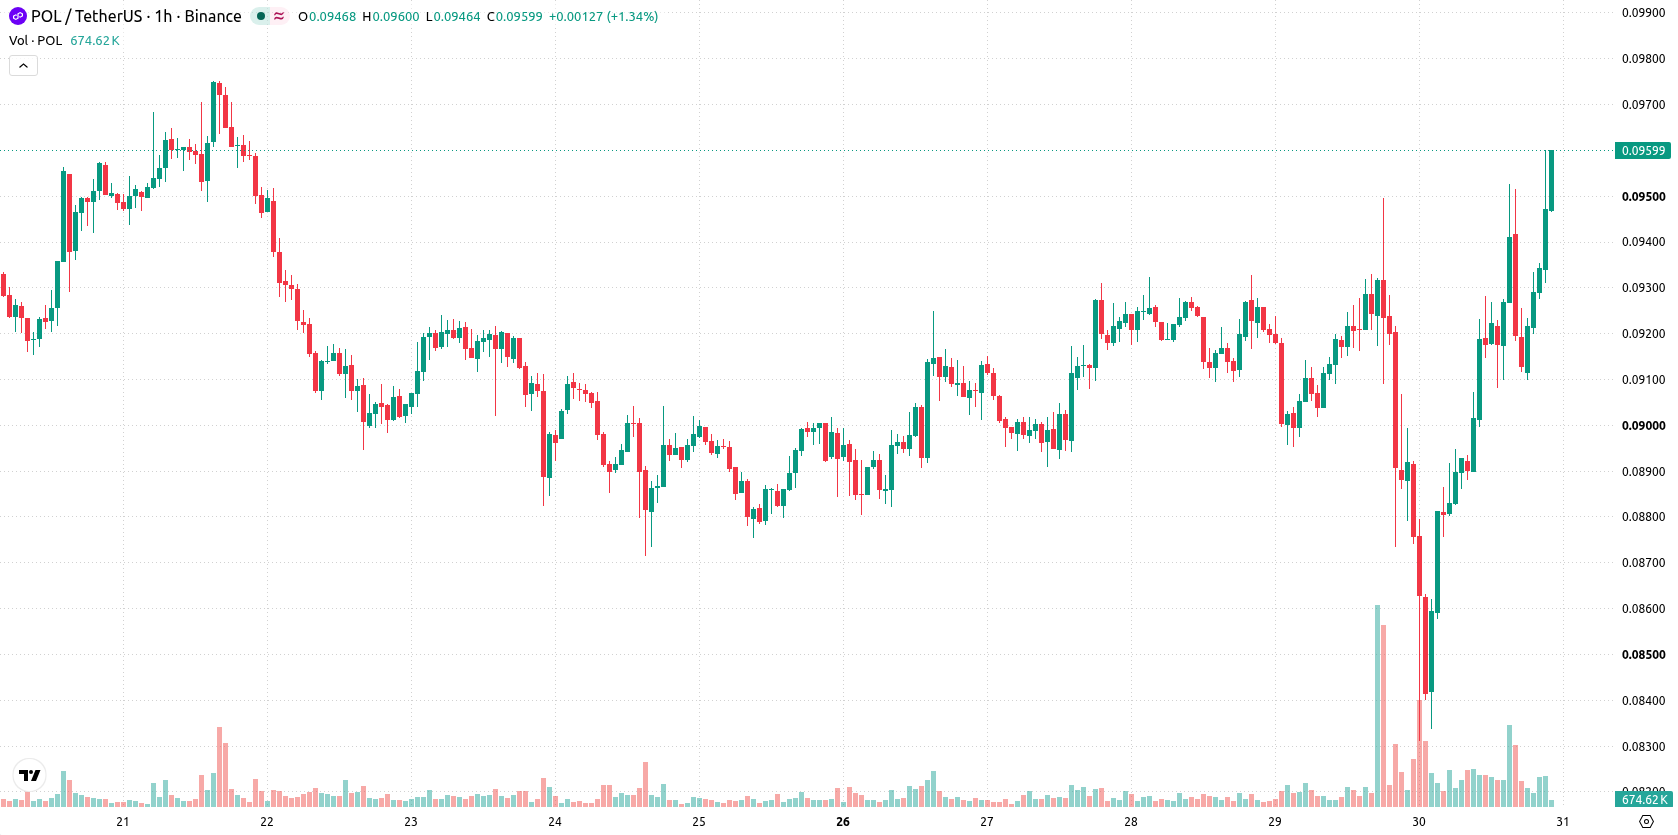
Polygon (POL) is trading at $0.0959, up 7.8% on the day, with price maintaining a position above its key moving averages.
 0.0923
0.0965
Highlights
- Polygon Labs now enables Solana-based businesses to access bank payments, stablecoin conversion, and digital wallets through its Open Money Stack integration.
- This integration provides Solana enterprises with regulated payment services via a unified platform, reducing the need for separate infrastructure and streamlining cross-chain transfers.
- Price trades above key moving averages on all timeframes with bullish momentum signals, targeting a $0.0929 to $0.0977 range over the next 2 to 3 days.
Enterprise adoption rises as Polygon expands payment stack to Solana
Polygon Labs has expanded its Open Money Stack payments infrastructure to support the Solana blockchain, enabling Solana-based businesses to access bank payments, stablecoin conversion, digital wallets, and streamlined payouts through a single integration, according to Cryptobriefing. This integration allows businesses operating on Solana to leverage Polygon’s regulated payment services without needing to rebuild their own infrastructure, which enhances utility and lowers operational barriers. By providing a unified platform for cross-chain asset transfers and payments, Polygon broadens its reach among enterprise users and promotes further adoption of its technology, as reported by Bitcoinist.
Momentum signals strengthen as buyers sustain price above support
On the technical side, POL is currently trading above the MA-20 and MA-50 on the H1 chart, as well as above the MA-200 on the daily timeframe. The Ichimoku Kijun level at $0.0892 offers immediate support for the price. Momentum signals, including MACD and ADX, are bullish, with RSI tracking at 59.9 and CCI also in supportive territory, while Stochastic RSI is neutral. Bull/Bear Power confirms ongoing buyer dominance during intraday trading, while the Awesome Oscillator remains neutral, offering neither additional confirmation nor contradiction to the prevailing trend.
Limited downside risk as consolidation favors bullish continuation
Over the next 2 to 3 trading days, POL is expected to remain within the $0.0929 to $0.0977 range, reflecting a volatility band relative to current levels. The baseline scenario sees price stabilizing in this corridor, with a high probability of an upward move and limited downside risk. Should resistance break to the upside, a bullish continuation is likely, while a failure at the Ichimoku Kijun support would trigger a pullback scenario.
Previously it was reported that Polygon Labs expanded its Open Money Stack payments infrastructure to the Solana blockchain, enabling cross-chain payment solutions for businesses. With POL currently consolidating above major technical supports and momentum signals remaining positive, traders should monitor for a decisive move beyond current resistance as a potential trigger for the next directional leg.






Latest Polygon News





-
 Afghanistan
-
 Albania
-
 Algeria
-
 Angola
-
 Argentina
-
 Armenia
-
 Australia
-
 Austria
-
 Azerbaijan
-
 Bahamas
-
 Bahrain
-
 Bangladesh
-
 Belarus
-
 Belgium
-
 Bolivia
-
 Botswana
-
 Brazil
-
 Brunei
-
 Bulgaria
-
 Cambodia
-
 Cameroon
-
 Canada
-
 Chile
-
 China
-
 Colombia
-
 Congo
-
 Costa Rica
-
 Cote d'Ivoire
-
 Croatia
-
 Cuba
-
 Cyprus
-
 Czechia
-
 DR Congo
-
 Denmark
-
 Dominican Republic
-
 Ecuador
-
 Egypt
-
 El Salvador
-
 Estonia
-
 Eswatini
-
 Ethiopia
-
 Finland
-
 France
-
 Georgia
-
 Germany
-
 Ghana
-
 Greece
-
 Haiti
-
 Hong Kong
-
 Hungary
-
 India
-
 Indonesia
-
 Iran, Islamic republic
-
 Iraq
-
 Ireland
-
 Israel
-
 Italy
-
 Jamaica
-
 Japan
-
 Jordan
-
 Kazakhstan
-
 Kenya
-
 Korea
-
 Kuwait
-
 Kyrgyzstan
-
 Laos
-
 Latvia
-
 Lebanon
-
 Lesotho
-
 Libya
-
 Lithuania
-
 Luxembourg
-
 Madagascar
-
 Malaysia
-
 Malta
-
 Mauritius
-
 Mexico
-
 Moldova
-
 Mongolia
-
 Montenegro
-
 Morocco
-
 Mozambique
-
 Myanmar
-
 Namibia
-
 Nepal
-
 Netherlands
-
 New Zealand
-
 Nigeria
-
 North Macedonia
-
 Norway
-
 Oman
-
 Pakistan
-
 Palestine
-
 Panama
-
 Papua New Guinea
-
 Paraguay
-
 Peru
-
 Philippines
-
 Poland
-
 Portugal
-
 Puerto Rico
-
 Qatar
-
 Reunion
-
 Romania
-
 Rwanda
-
 Saudi Arabia
-
 Serbia
-
 Singapore
-
 Slovakia
-
 Slovenia
-
 Somalia
-
 South Africa
-
 Spain
-
 Sri Lanka
-
 Sweden
-
 Switzerland
-
 Syria
-
 Taiwan
-
 Tajikistan
-
 Tanzania
-
 Thailand
-
 Trinidad and Tobago
-
 Tunisia
-
 Turkey
-
 UAE
-
 Uganda
-
 Ukraine
-
 United Kingdom
-
United States
-
 Uruguay
-
 Uzbekistan
-
 Venezuela
-
 Vietnam
-
 Yemen
-
 Zambia
-
 Zimbabwe
- Forex
- Crypto












