
S&P 500 holds near 6,900 as markets lean into Venezuela shock and risk appetite stays firm

The S&P 500 is starting the new year on firm footing, trading near 6,900 Tuesday after extending Monday’s rally that lifted the index 0.64%. Futures are flat in early Tuesday trade, signaling consolidation rather than reversal as investors digest a rare mix of geopolitical shock and resilient risk appetite.
Highlights
- The S&P 500 trades near 6,900 after Monday’s 0.64% gain, with futures signaling consolidation.
- Energy and financial stocks lead gains as investors treat Venezuela developments as pro-growth.
- The index remains above all major moving averages, keeping the primary uptrend intact.
The market’s reaction to the U.S. capture of Venezuelan President Nicolás Maduro has been telling. Instead of triggering a flight to safety, equities leaned into the development after President Donald Trump urged American companies to invest in Venezuela’s oil sector, reframing the event as a potential growth catalyst.
That framing shaped sector leadership. Energy names rallied alongside financials, with Chevron and Goldman Sachs setting the tone, while megacap technology provided steady support rather than outsized leadership. Price action suggests the market is interpreting the event less as a destabilizing geopolitical risk and more as a contained shock with selective upside implications.
Trend strength holds as momentum cools
On the daily chart, the S&P 500 remains in a well-defined primary uptrend that has been intact since spring. Price is holding comfortably above all major EMAs, with the 20-day near 6,856, the 50-day around 6,795, the 100-day close to 6,666, and the 200-day rising steadily near 6,421. This clean bullish EMA stack continues to confirm trend strength.
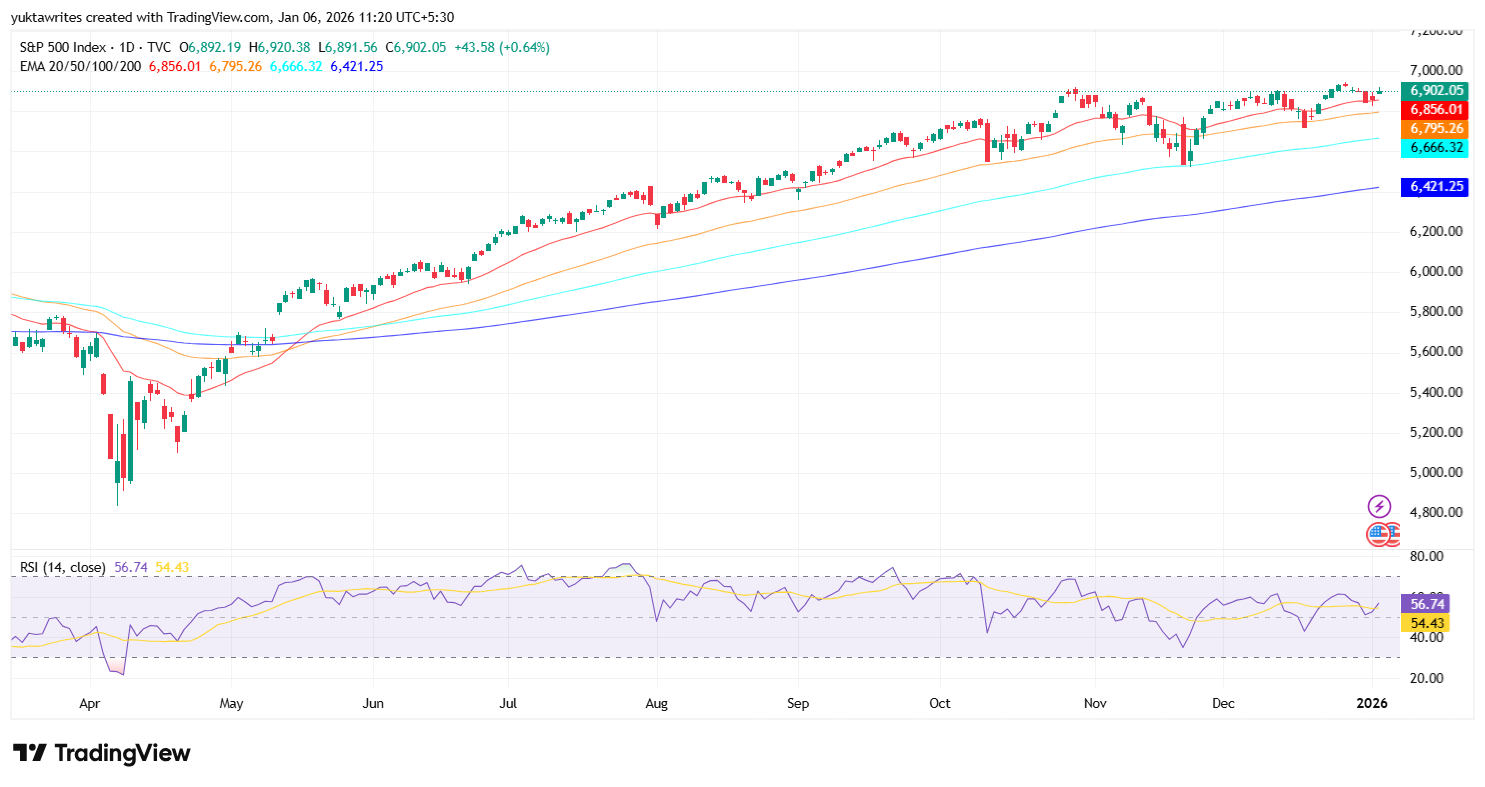
S&P 500 price dynamics (Source: TradingView)
Each pullback since October has been absorbed above the 50-day average, reinforcing it as the first meaningful line of defense for buyers. Momentum, however, is no longer accelerating. Daily RSI is hovering in the mid-50s, reflecting balance rather than excess. That signals buyers remain in control, but they are no longer chasing price aggressively at record levels.
Shorter-term charts add texture to that view. On the 30-minute timeframe, the index slipped into a choppy, sideways range after a strong late-December push, briefly losing momentum before rebounding again in early January. The Supertrend has flipped back to bullish near 6,873, while parabolic SAR dots trail below price around 6,898, indicating short-term control has returned to buyers. Still, the index has struggled to generate clean follow-through above the 6,920 to 6,950 zone, which has capped recent intraday rallies and now acts as immediate resistance.
Risk sentiment remains constructive
From a market-structure perspective, the current action looks more like digestion than distribution. Volume has tapered slightly compared with the strong December advance, suggesting consolidation rather than outright selling pressure. Sentiment across risk assets remains constructive, reinforcing the equity bid.
Crypto markets have also remained stable, with major assets holding recent gains and on-chain indicators showing no broad rush to de-risk. That matters for equities, as the S&P 500 has remained closely linked to overall liquidity conditions and risk appetite. As long as crypto markets are not flashing stress through rising exchange inflows or forced liquidations, equity traders are less inclined to expect sudden downside shocks.
Macro focus is already shifting toward domestic catalysts. This week’s labor market data, particularly the December jobs report, is the next major test. With the index priced for near-perfect outcomes, even modest surprises could influence expectations around Federal Reserve policy timing. For now, bond yields have remained stable, allowing equities to digest gains without pressure from the rates side.
Levels that define the next move
The bullish scenario is straightforward. As long as the S&P 500 holds above the 6,850 to 6,800 zone, where the 20-day and 50-day EMAs converge, the path of least resistance remains higher. A decisive break and close above 6,950 would reopen the path toward the psychological 7,000 level, with extension potential toward 7,050 to 7,100 if momentum re-accelerates. That outcome likely requires continued strength in cyclicals, steady yields, and no negative surprises from labor data.
The bearish case remains tactical rather than structural. Failure to clear 6,950 followed by a break below 6,800 would signal that consolidation is giving way to a deeper pullback. Below that, the next meaningful support sits near 6,660 at the 100-day EMA, with the 200-day near 6,420 marking the level where longer-term trend integrity would be tested. A hawkish shift in rate expectations would be the most obvious catalyst for such a move.
Previously, we noted that late-2025 strength in the S&P 500 was increasingly driven by selective sector leadership rather than broad-based participation. The current price action supports that view, with gains being sustained by energy, financials, and megacap stability rather than indiscriminate risk-taking.


Latest S&P 500 News


-
 Afghanistan
-
 Albania
-
 Algeria
-
 Angola
-
 Argentina
-
 Armenia
-
 Australia
-
 Austria
-
 Azerbaijan
-
 Bahamas
-
 Bahrain
-
 Bangladesh
-
 Belarus
-
 Belgium
-
 Bolivia
-
 Botswana
-
 Brazil
-
 Brunei
-
 Bulgaria
-
 Cambodia
-
 Cameroon
-
 Canada
-
 Chile
Chile
-
 China
China
-
 Colombia
-
 Congo
Congo
-
 Costa Rica
-
 Cote d'Ivoire
-
 Croatia
-
 Cuba
Cuba
-
 Cyprus
-
 Czechia
-
 DR Congo
-
 Denmark
-
 Dominican Republic
-
 Ecuador
-
 Egypt
Egypt
-
 El Salvador
-
 Estonia
-
 Eswatini
-
 Ethiopia
-
 Finland
-
 France
-
 Georgia
-
 Germany
-
 Ghana
Ghana
-
 Greece
-
 Haiti
Haiti
-
 Hong Kong
-
 Hungary
-
 India
India
-
 Indonesia
-
 Iran, Islamic republic
-
 Iraq
Iraq
-
 Ireland
-
 Israel
-
 Italy
Italy
-
 Jamaica
-
 Japan
Japan
-
 Jordan
-
 Kazakhstan
-
 Kenya
Kenya
-
 Korea
Korea
-
 Kuwait
-
 Kyrgyzstan
-
 Laos
Laos
-
 Latvia
-
 Lebanon
-
 Lesotho
-
 Libya
Libya
-
 Lithuania
-
 Luxembourg
-
 Madagascar
-
 Malaysia
-
 Malta
Malta
-
 Mauritius
-
 Mexico
-
 Moldova
-
 Mongolia
-
 Montenegro
-
 Morocco
-
 Mozambique
-
 Myanmar
-
 Namibia
-
 Nepal
Nepal
-
 Netherlands
-
 New Zealand
-
 Nigeria
-
 North Macedonia
-
 Norway
-
 Oman
Oman
-
 Pakistan
-
 Palestine
-
 Panama
-
 Papua New Guinea
-
 Paraguay
-
 Peru
Peru
-
 Philippines
-
 Poland
-
 Portugal
-
 Puerto Rico
-
 Qatar
Qatar
-
 Reunion
-
 Romania
-
 Rwanda
-
 Saudi Arabia
-
 Serbia
-
 Singapore
-
 Slovakia
-
 Slovenia
-
 Somalia
-
 South Africa
-
 Spain
Spain
-
 Sri Lanka
-
 Sweden
-
 Switzerland
-
 Syria
Syria
-
 Taiwan
-
 Tajikistan
-
 Tanzania
-
 Thailand
-
 Trinidad and Tobago
-
 Tunisia
-
 Turkey
-
 UAE
UAE
-
 Uganda
-
 Ukraine
-
 United Kingdom
-
United States
-
 Uruguay
-
 Uzbekistan
-
 Venezuela
-
 Vietnam
-
 Yemen
Yemen
-
 Zambia
-
 Zimbabwe
- Forex
- Crypto
