
Bit Digital stock price forecast: downside risk stays elevated as BTBT loses 3.59%

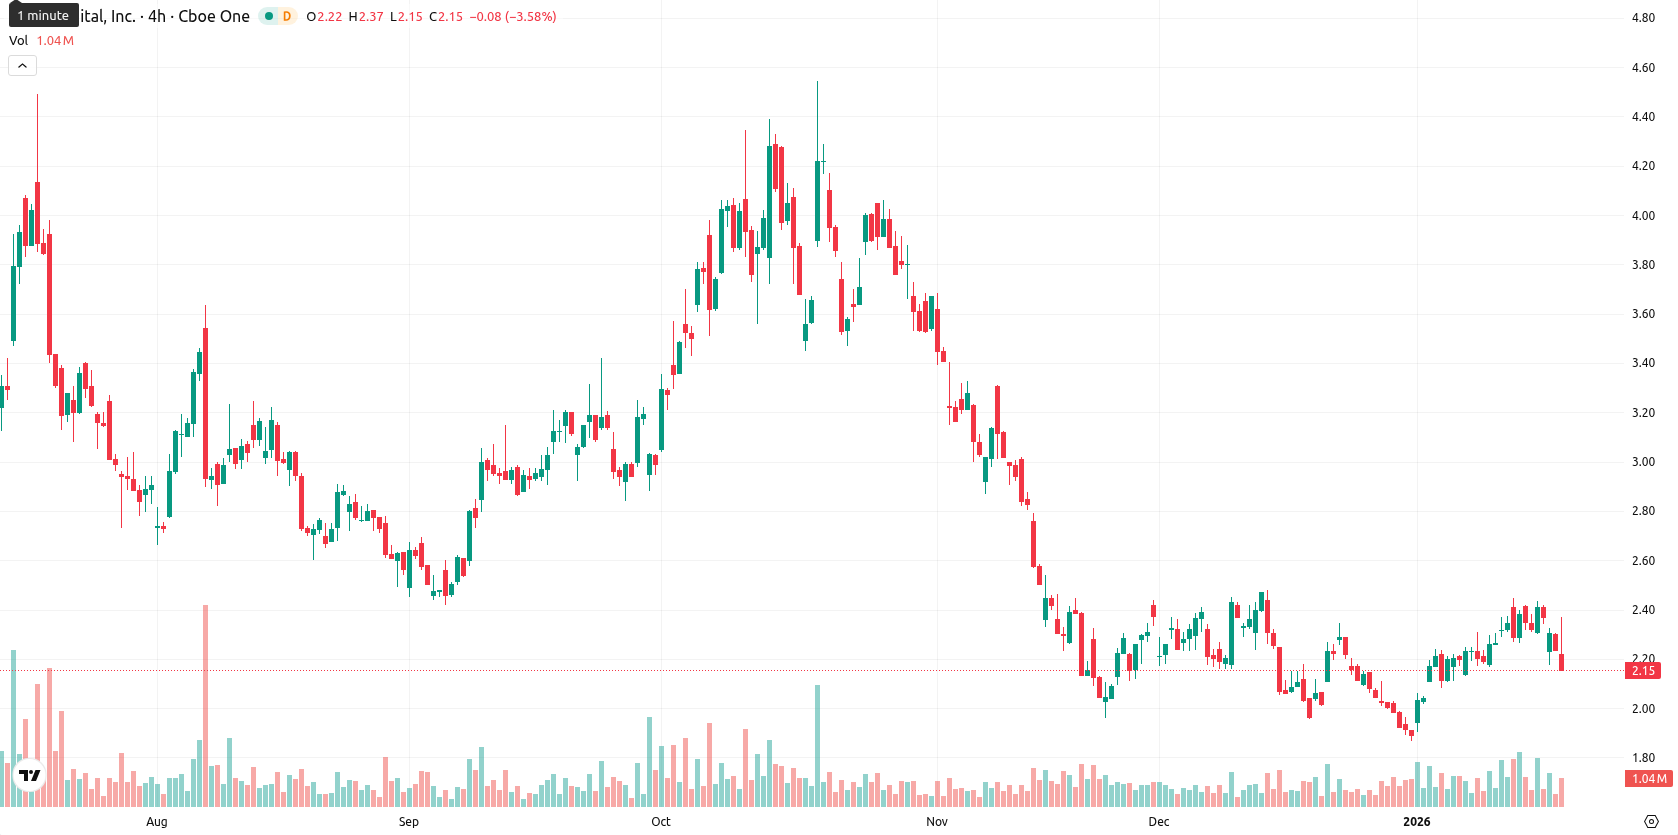
Bit Digital Inc (BTBT) is trading below the MA-20 ($2.18), MA-50 ($2.30), and well beneath the MA-200 ($2.69), indicating persistent pressure from sellers in short-, medium-, and long-term perspectives.
Highlights
- BTBT trades below MA-20 ($2.18), MA-50 ($2.30), and MA-200 ($2.69), indicating persistent multi-timeframe selling pressure with resistance clustered around these levels.
- Momentum indicators show a neutral to bearish stance with MACD neutral, RSI below 50 and declining, Stochastic RSI signaling strong sell, and intraday action down 3.59% near today's low.
- Next five days, BTBT is expected to range between $2.05 and $2.30, with less than a 20% probability of a price increase amid prevailing bearish signals.
Momentum weakness as resistance holds and volatility spikes
The closest dynamic support is at the Ichimoku Kijun level ($2.17), while resistance remains near the MA-20 and MA-50, signaling a challenging environment for a sustained rebound. Momentum indicators reflect a neutral to slightly bearish bias, with MACD showing neutrality and the ADX at a low value, confirming the lack of strong directional conviction. RSI is below 50 and pointing down, and the Stochastic RSI signals strong sell, suggesting mild oversold conditions. CCI is neutral, while Bull/Bear Power indicates tentative buyer support intraday, but the current price move—down 3.59% with no notable gap at the open—lands near today’s low, reflecting high volatility and persistent bearish tone after the open. Awesome Oscillator points to some buyer activity, but overall, momentum signals mildly contradict the brief buyer pressure, emphasizing an underlying weakness.
Downside risk prevails amid low rebound odds and tight range
For the next five trading days, the expected price range is likely between $2.05 and $2.30, keeping the action close to the latest traded price due to recent heightened volatility. The probability of a price increase is very low (less than 20%), while a further decline is substantially more likely, given bearish signals from the weekly Moving Averages, RSI, and MACD. In the baseline scenario, BTBT should remain sideways within the $2.05 to $2.30 range. A bullish scenario would require a decisive move above $2.30, supported by stronger buying momentum, while a bearish outcome could see a breakdown below $2.05 if further selling pressure emerges.
Last time, analysts noted that Bit Digital Inc. is trading just above its short-term moving average but faces continued resistance from both medium- and long-term moving averages, suggesting downward pressure despite immediate support. Momentum and oscillator signals remain mixed, with neutral MACD and ADX, weak RSI, and strong oversold conditions on Stoch RSI indicating a pressured tone and persistent volatility near current support and resistance levels.


Latest Bit Digital News


-
 Afghanistan
-
 Albania
-
 Algeria
-
 Angola
-
 Argentina
-
 Armenia
-
 Australia
-
 Austria
-
 Azerbaijan
-
 Bahamas
-
 Bahrain
-
 Bangladesh
-
 Belarus
-
 Belgium
-
 Bolivia
-
 Botswana
-
 Brazil
-
 Brunei
-
 Bulgaria
-
 Cambodia
-
 Cameroon
-
 Canada
-
 Chile
Chile
-
 China
China
-
 Colombia
-
 Congo
Congo
-
 Costa Rica
-
 Cote d'Ivoire
-
 Croatia
-
 Cuba
Cuba
-
 Cyprus
-
 Czechia
-
 DR Congo
-
 Denmark
-
 Dominican Republic
-
 Ecuador
-
 Egypt
Egypt
-
 El Salvador
-
 Estonia
-
 Eswatini
-
 Ethiopia
-
 Finland
-
 France
-
 Georgia
-
 Germany
-
 Ghana
Ghana
-
 Greece
-
 Haiti
Haiti
-
 Hong Kong
-
 Hungary
-
 India
India
-
 Indonesia
-
 Iran, Islamic republic
-
 Iraq
Iraq
-
 Ireland
-
 Israel
-
 Italy
Italy
-
 Jamaica
-
 Japan
Japan
-
 Jordan
-
 Kazakhstan
-
 Kenya
Kenya
-
 Korea
Korea
-
 Kuwait
-
 Kyrgyzstan
-
 Laos
Laos
-
 Latvia
-
 Lebanon
-
 Lesotho
-
 Libya
Libya
-
 Lithuania
-
 Luxembourg
-
 Madagascar
-
 Malaysia
-
 Malta
Malta
-
 Mauritius
-
 Mexico
-
 Moldova
-
 Mongolia
-
 Montenegro
-
 Morocco
-
 Mozambique
-
 Myanmar
-
 Namibia
-
 Nepal
Nepal
-
 Netherlands
-
 New Zealand
-
 Nigeria
-
 North Macedonia
-
 Norway
-
 Oman
Oman
-
 Pakistan
-
 Palestine
-
 Panama
-
 Papua New Guinea
-
 Paraguay
-
 Peru
Peru
-
 Philippines
-
 Poland
-
 Portugal
-
 Puerto Rico
-
 Qatar
Qatar
-
 Reunion
-
 Romania
-
 Rwanda
-
 Saudi Arabia
-
 Serbia
-
 Singapore
-
 Slovakia
-
 Slovenia
-
 Somalia
-
 South Africa
-
 Spain
Spain
-
 Sri Lanka
-
 Sweden
-
 Switzerland
-
 Syria
Syria
-
 Taiwan
-
 Tajikistan
-
 Tanzania
-
 Thailand
-
 Trinidad and Tobago
-
 Tunisia
-
 Turkey
-
 UAE
UAE
-
 Uganda
-
 Ukraine
-
 United Kingdom
-
United States
-
 Uruguay
-
 Uzbekistan
-
 Venezuela
-
 Vietnam
-
 Yemen
Yemen
-
 Zambia
-
 Zimbabwe
- Forex
- Crypto
