
Marathon Digital stock price forecast: persistent downside bias as MARA trades below resistance

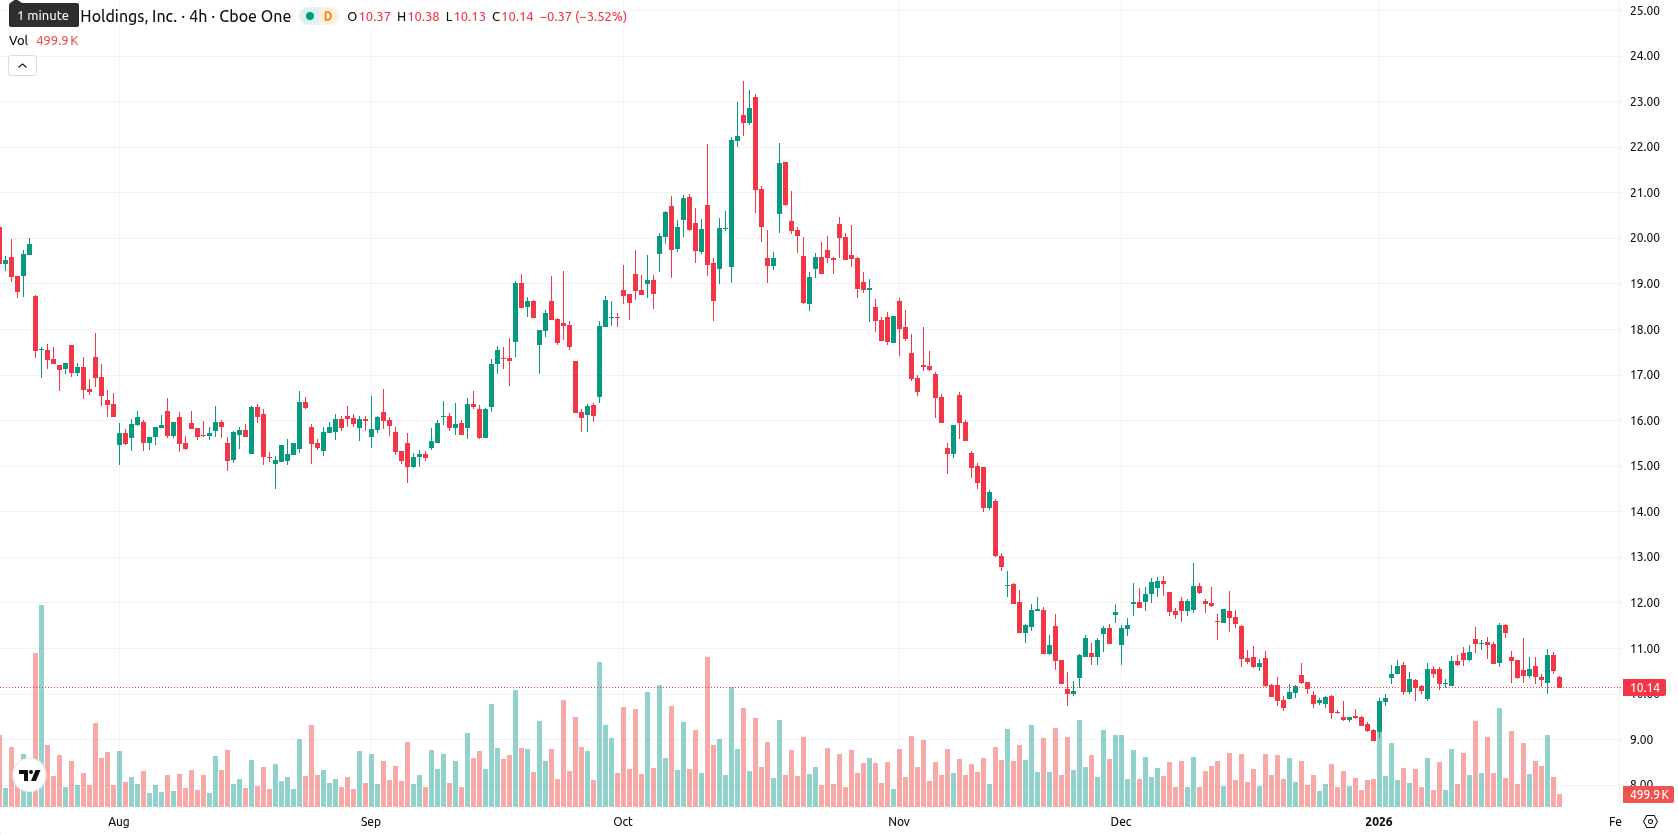
Marathon Digital Holdings, Inc. (MARA, formerly Marathon Patent Group) is trading at $10.17 and declined by 3.19% today, closing near its daily low. The asset sits below key moving averages — MA-20 at $10.27, MA-50 at $11.00, and MA-200 at $15.05 — illustrating sustained pressure with no technical support from the averages above the current level.
Highlights
- MARA trades at $10.17, below its MA-20 ($10.27), MA-50 ($11.00), and MA-200 ($15.05), signaling persistent seller dominance across all timeframes.
- Momentum indicators (MACD D1/W1) and oscillators (RSI, Stochastic RSI) forecast continued downward pressure, with intraday price action showing low volatility and a 3.19% decline today.
- Expected price range for the next five days is $9.80–$10.99, with sub-20% probability of upside and resistance at $10.26–$11.00 likely to cap rebounds.
Momentum weakens as oversold signals fail to deter sellers
Technical analysis signals ongoing weakness for MARA, as it trades under the MA-20, MA-50, and MA-200, with dynamic resistance forming near the Ichimoku Kijun at $10.26. There is no significant support above the current price, reinforcing the dominance of sellers in the short, medium, and long term. Momentum indicators, including MACD on both daily and weekly timeframes, suggest pronounced downward momentum. The ADX is neutral, while oscillators such as RSI and Stochastic RSI show oversold conditions on lower timeframes but maintain a sell bias on D1 and W1. Bull/Bear Power is also oversold, reflecting persistent seller dominance intraday. The stock has stayed within a tight, low-volatility range, in line with these momentum and oscillator signals.
Bearish bias persists as upside resistance limits reversal odds
In the immediate term, MARA is expected to trade between $9.80 and $10.99, reflecting a typical volatility band relative to current levels. The probability of a price increase is low — less than 20% — so a further decline remains more likely unless significant resistance at $10.26 to $11.00 is overcome. Most likely, price action will be sideways between $9.80 and $10.99. Should the price fall below $9.80, this would confirm continued seller control.
Last time, analysts noted that Marathon Digital Holdings, Inc. was trading above its short-term moving average but remained below key medium and long-term averages, with resistance near the MA-50 and support at the Ichimoku Kijun. Mixed momentum signals, including a bearish MACD, weak trend strength, and neutral oscillators, highlighted constrained direction within technical boundaries despite a modestly bullish intraday tone.


-
 Afghanistan
-
 Albania
-
 Algeria
-
 Angola
-
 Argentina
-
 Armenia
-
 Australia
-
 Austria
-
 Azerbaijan
-
 Bahamas
-
 Bahrain
-
 Bangladesh
-
 Belarus
-
 Belgium
-
 Bolivia
-
 Botswana
-
 Brazil
-
 Brunei
-
 Bulgaria
-
 Cambodia
-
 Cameroon
-
 Canada
-
 Chile
Chile
-
 China
China
-
 Colombia
-
 Congo
Congo
-
 Costa Rica
-
 Cote d'Ivoire
-
 Croatia
-
 Cuba
Cuba
-
 Cyprus
-
 Czechia
-
 DR Congo
-
 Denmark
-
 Dominican Republic
-
 Ecuador
-
 Egypt
Egypt
-
 El Salvador
-
 Estonia
-
 Eswatini
-
 Ethiopia
-
 Finland
-
 France
-
 Georgia
-
 Germany
-
 Ghana
Ghana
-
 Greece
-
 Haiti
Haiti
-
 Hong Kong
-
 Hungary
-
 India
India
-
 Indonesia
-
 Iran, Islamic republic
-
 Iraq
Iraq
-
 Ireland
-
 Israel
-
 Italy
Italy
-
 Jamaica
-
 Japan
Japan
-
 Jordan
-
 Kazakhstan
-
 Kenya
Kenya
-
 Korea
Korea
-
 Kuwait
-
 Kyrgyzstan
-
 Laos
Laos
-
 Latvia
-
 Lebanon
-
 Lesotho
-
 Libya
Libya
-
 Lithuania
-
 Luxembourg
-
 Madagascar
-
 Malaysia
-
 Malta
Malta
-
 Mauritius
-
 Mexico
-
 Moldova
-
 Mongolia
-
 Montenegro
-
 Morocco
-
 Mozambique
-
 Myanmar
-
 Namibia
-
 Nepal
Nepal
-
 Netherlands
-
 New Zealand
-
 Nigeria
-
 North Macedonia
-
 Norway
-
 Oman
Oman
-
 Pakistan
-
 Palestine
-
 Panama
-
 Papua New Guinea
-
 Paraguay
-
 Peru
Peru
-
 Philippines
-
 Poland
-
 Portugal
-
 Puerto Rico
-
 Qatar
Qatar
-
 Reunion
-
 Romania
-
 Rwanda
-
 Saudi Arabia
-
 Serbia
-
 Singapore
-
 Slovakia
-
 Slovenia
-
 Somalia
-
 South Africa
-
 Spain
Spain
-
 Sri Lanka
-
 Sweden
-
 Switzerland
-
 Syria
Syria
-
 Taiwan
-
 Tajikistan
-
 Tanzania
-
 Thailand
-
 Trinidad and Tobago
-
 Tunisia
-
 Turkey
-
 UAE
UAE
-
 Uganda
-
 Ukraine
-
 United Kingdom
-
United States
-
 Uruguay
-
 Uzbekistan
-
 Venezuela
-
 Vietnam
-
 Yemen
Yemen
-
 Zambia
-
 Zimbabwe
- Forex
- Crypto
