
Nano Dimension stock price forecast: Bullish bias faces resistance as NNDM slips 3.07%

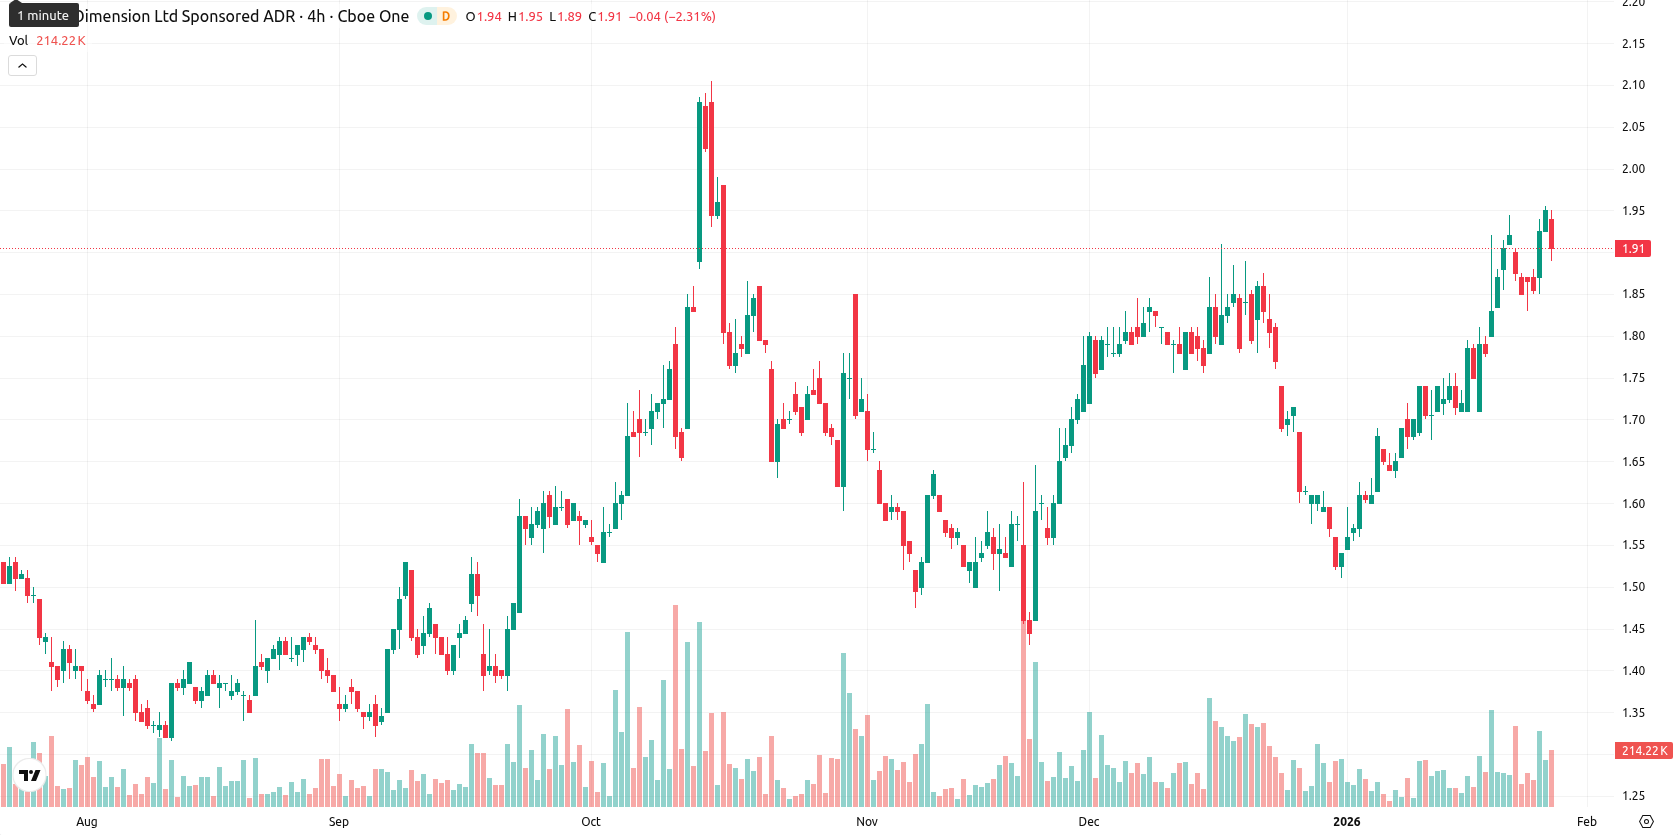
Nano Dimension Ltd (NNDM) is trading above key Moving Averages, with the current price of $1.89 well above the MA-20 at $1.72, MA-50 at $1.71, and MA-200 at $1.58. This alignment signifies a bullish structure across short-, medium-, and long-term timeframes, with nearest dynamic support at the Ichimoku Kijun around $1.73 and the MA-50 providing near-term resistance.
Highlights
- NNDM trades at $1.89, well above its MA-20 ($1.72), MA-50 ($1.71), and MA-200 ($1.58), reinforcing a bullish structure across all timeframes.
- Momentum remains positive with MACD and ADX signaling further upside, but overbought readings on Stochastic RSI (87.95) and CCI (142.50) suggest near-term consolidation.
- Key levels for the next five days are support at $1.73 and resistance near $1.95, with an 80% probability of price upside toward $2.05.
Overbought signals temper bullish momentum as volatility remains low
Momentum signals are positive, as both the MACD and ADX on the daily chart indicate upward momentum, though the ADX reading is modest. Overbought conditions are signaled by the Stochastic RSI at 87.95 and the Commodity Channel Index at 142.50, while the RSI is elevated at 69.26 but not yet extreme. Bull/Bear Power is positive, showing buyer dominance intraday, and the Awesome Oscillator supports the upward trend. Today saw no gap between sessions, but the price slipped 3.07% to $1.89, closing near the low of the daily range ($1.89 – $1.95), reflecting low intraday volatility and sustained pressure after the open. These short-term overbought readings contrast with ongoing bullish momentum, which may point to near-term consolidation or a pause.
Sideways stabilization likely as range tightens and upside risk builds
For the next five trading days, the expected price range is adjusted to $1.74 – $2.05, ensuring the span closely tracks the current price level. There is a high probability of further price increases (80%), while a decline is less likely. The baseline scenario sees NNDM stabilizing sideways between support at $1.73 and resistance near $1.95. In the bullish scenario, a clear move above $1.95 could prompt a test of the psychological $2.00 level or higher. Alternatively, a drop below $1.73 would signal a bearish turn, exposing the next support zone near $1.71.
Previously it was reported that Nano Dimension Ltd is exhibiting a bullish structure, trading above short-, medium-, and long-term moving averages, with positive momentum signals from both the MACD and RSI. The price is consolidating near today’s high with dynamic support at $1.73 and resistance near $2.00, where overbought indicators suggest some caution despite an overall high probability for further upside.


Latest Nano Dimension News


-
 Afghanistan
-
 Albania
-
 Algeria
-
 Angola
-
 Argentina
-
 Armenia
-
 Australia
-
 Austria
-
 Azerbaijan
-
 Bahamas
-
 Bahrain
-
 Bangladesh
-
 Belarus
-
 Belgium
-
 Bolivia
-
 Botswana
-
 Brazil
-
 Brunei
-
 Bulgaria
-
 Cambodia
-
 Cameroon
-
 Canada
-
 Chile
Chile
-
 China
China
-
 Colombia
-
 Congo
Congo
-
 Costa Rica
-
 Cote d'Ivoire
-
 Croatia
-
 Cuba
Cuba
-
 Cyprus
-
 Czechia
-
 DR Congo
-
 Denmark
-
 Dominican Republic
-
 Ecuador
-
 Egypt
Egypt
-
 El Salvador
-
 Estonia
-
 Eswatini
-
 Ethiopia
-
 Finland
-
 France
-
 Georgia
-
 Germany
-
 Ghana
Ghana
-
 Greece
-
 Haiti
Haiti
-
 Hong Kong
-
 Hungary
-
 India
India
-
 Indonesia
-
 Iran, Islamic republic
-
 Iraq
Iraq
-
 Ireland
-
 Israel
-
 Italy
Italy
-
 Jamaica
-
 Japan
Japan
-
 Jordan
-
 Kazakhstan
-
 Kenya
Kenya
-
 Korea
Korea
-
 Kuwait
-
 Kyrgyzstan
-
 Laos
Laos
-
 Latvia
-
 Lebanon
-
 Lesotho
-
 Libya
Libya
-
 Lithuania
-
 Luxembourg
-
 Madagascar
-
 Malaysia
-
 Malta
Malta
-
 Mauritius
-
 Mexico
-
 Moldova
-
 Mongolia
-
 Montenegro
-
 Morocco
-
 Mozambique
-
 Myanmar
-
 Namibia
-
 Nepal
Nepal
-
 Netherlands
-
 New Zealand
-
 Nigeria
-
 North Macedonia
-
 Norway
-
 Oman
Oman
-
 Pakistan
-
 Palestine
-
 Panama
-
 Papua New Guinea
-
 Paraguay
-
 Peru
Peru
-
 Philippines
-
 Poland
-
 Portugal
-
 Puerto Rico
-
 Qatar
Qatar
-
 Reunion
-
 Romania
-
 Rwanda
-
 Saudi Arabia
-
 Serbia
-
 Singapore
-
 Slovakia
-
 Slovenia
-
 Somalia
-
 South Africa
-
 Spain
Spain
-
 Sri Lanka
-
 Sweden
-
 Switzerland
-
 Syria
Syria
-
 Taiwan
-
 Tajikistan
-
 Tanzania
-
 Thailand
-
 Trinidad and Tobago
-
 Tunisia
-
 Turkey
-
 UAE
UAE
-
 Uganda
-
 Ukraine
-
 United Kingdom
-
United States
-
 Uruguay
-
 Uzbekistan
-
 Venezuela
-
 Vietnam
-
 Yemen
Yemen
-
 Zambia
-
 Zimbabwe
- Forex
- Crypto
