
Nano Dimension stock: Bullish technicals and buyer dominance fail to prevent 3.43% decline

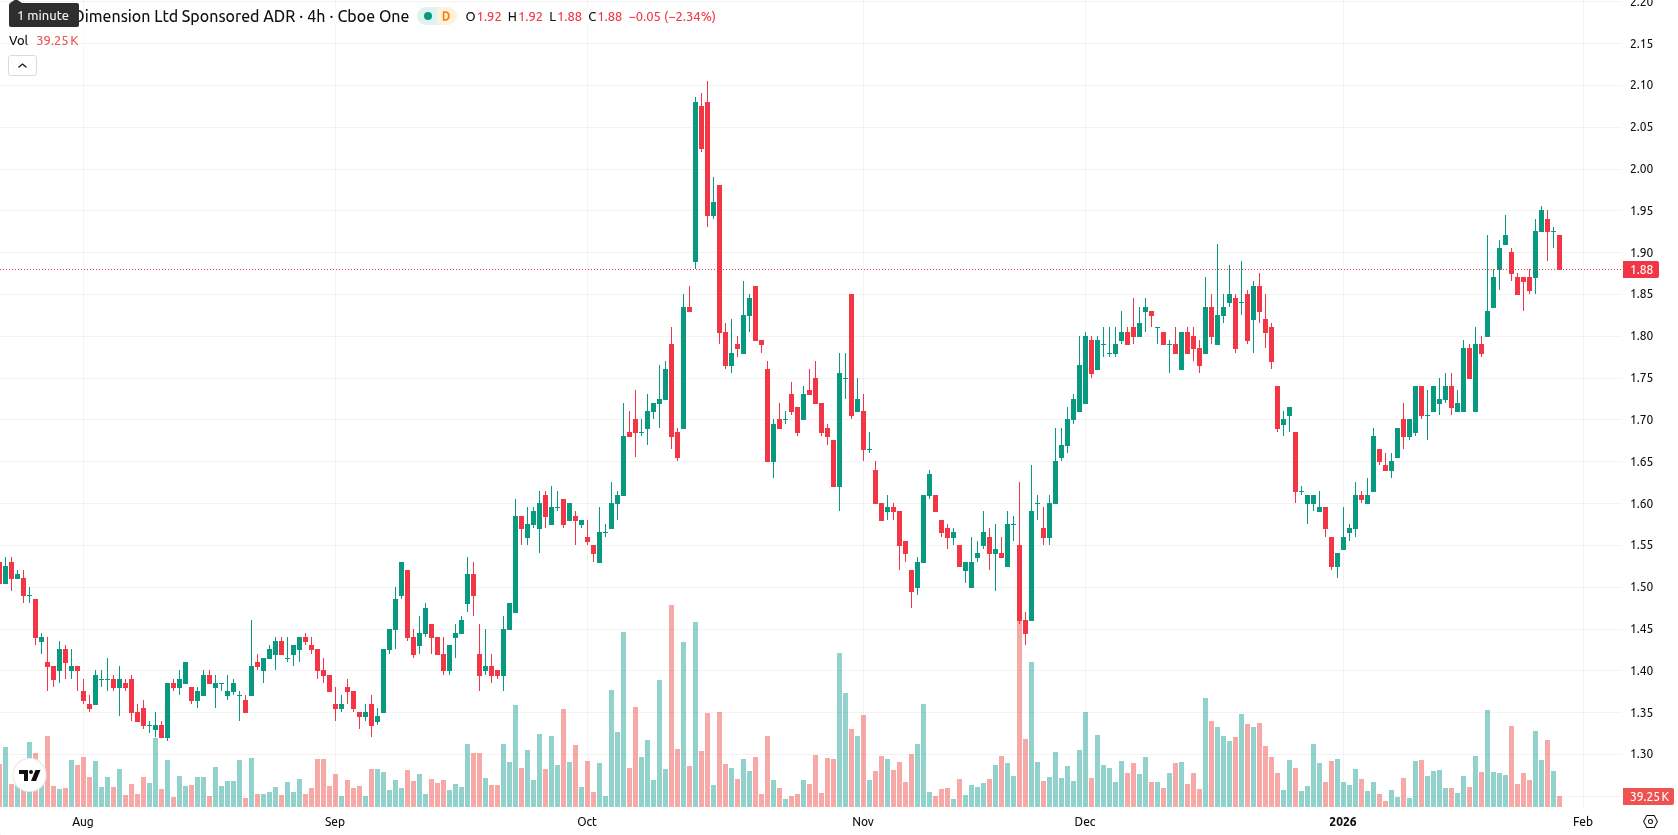
Nano Dimension (NNDM) is trading at $1.85, which sits above its 20-day ($1.74), 50-day ($1.72), and 200-day ($1.58) Moving Averages, confirming a bullish structure for both short- and longer-term outlooks.
Highlights
- Nano Dimension (NNDM) trades at $1.85, above key 20-day ($1.74), 50-day ($1.72), and 200-day ($1.58) Moving Averages, confirming a bullish structure.
- Momentum indicators such as MACD and ADX signal 'Buy' while the RSI remains bullish but not overbought, though short-term signals are overheated.
- Trading is expected sideways within $1.75–$1.95 over the next five sessions, with $1.95 acting as resistance and $1.75 as critical support.
Momentum signals strengthen as overbought indicators call for caution
The nearest dynamic support is indicated by the Ichimoku Kijun at $1.74, while resistance is next likely at the 50-day Moving Average or the round level at $2.00. Momentum signals are positive, with the MACD and ADX both indicating a Buy, while the RSI sits in bullish territory but not overbought. However, the Stochastic RSI and Commodity Channel Index show overbought signals, suggesting caution as the short-term is overheated. Bull/Bear Power reflects buyer dominance, while the Awesome Oscillator supports the existing upward trend.
Sideways range expected as upside breakout risk rises
In the coming five trading days, the expected price range for NNDM is $1.75 to $1.95. There is a very high probability (more than 80%) that the price will move higher, while the probability of a decline is much lower. The baseline scenario is sideways movement within this $1.75 – $1.95 volatility band relative to current levels. A bullish case could develop if the price breaks above $1.95, triggering further momentum toward $2.00, while a break below $1.75 would shift sentiment bearish and risk a test of long-term supports.
Previously it was reported that Nano Dimension Ltd is maintaining a bullish structure, trading well above its key moving averages across all timeframes, with upward momentum confirmed by positive MACD and ADX signals. Despite low volatility and persistent overbought readings from Stochastic RSI and CCI, the asset is likely to consolidate sideways near support at $1.73 and resistance at $1.95, with a high probability of further upside unless a decline below key support occurs.


Latest Nano Dimension News


-
 Afghanistan
-
 Albania
-
 Algeria
-
 Angola
-
 Argentina
-
 Armenia
-
 Australia
-
 Austria
-
 Azerbaijan
-
 Bahamas
-
 Bahrain
-
 Bangladesh
-
 Belarus
-
 Belgium
-
 Bolivia
-
 Botswana
-
 Brazil
-
 Brunei
-
 Bulgaria
-
 Cambodia
-
 Cameroon
-
 Canada
-
 Chile
Chile
-
 China
China
-
 Colombia
-
 Congo
Congo
-
 Costa Rica
-
 Cote d'Ivoire
-
 Croatia
-
 Cuba
Cuba
-
 Cyprus
-
 Czechia
-
 DR Congo
-
 Denmark
-
 Dominican Republic
-
 Ecuador
-
 Egypt
Egypt
-
 El Salvador
-
 Estonia
-
 Eswatini
-
 Ethiopia
-
 Finland
-
 France
-
 Georgia
-
 Germany
-
 Ghana
Ghana
-
 Greece
-
 Haiti
Haiti
-
 Hong Kong
-
 Hungary
-
 India
India
-
 Indonesia
-
 Iran, Islamic republic
-
 Iraq
Iraq
-
 Ireland
-
 Israel
-
 Italy
Italy
-
 Jamaica
-
 Japan
Japan
-
 Jordan
-
 Kazakhstan
-
 Kenya
Kenya
-
 Korea
Korea
-
 Kuwait
-
 Kyrgyzstan
-
 Laos
Laos
-
 Latvia
-
 Lebanon
-
 Lesotho
-
 Libya
Libya
-
 Lithuania
-
 Luxembourg
-
 Madagascar
-
 Malaysia
-
 Malta
Malta
-
 Mauritius
-
 Mexico
-
 Moldova
-
 Mongolia
-
 Montenegro
-
 Morocco
-
 Mozambique
-
 Myanmar
-
 Namibia
-
 Nepal
Nepal
-
 Netherlands
-
 New Zealand
-
 Nigeria
-
 North Macedonia
-
 Norway
-
 Oman
Oman
-
 Pakistan
-
 Palestine
-
 Panama
-
 Papua New Guinea
-
 Paraguay
-
 Peru
Peru
-
 Philippines
-
 Poland
-
 Portugal
-
 Puerto Rico
-
 Qatar
Qatar
-
 Reunion
-
 Romania
-
 Rwanda
-
 Saudi Arabia
-
 Serbia
-
 Singapore
-
 Slovakia
-
 Slovenia
-
 Somalia
-
 South Africa
-
 Spain
Spain
-
 Sri Lanka
-
 Sweden
-
 Switzerland
-
 Syria
Syria
-
 Taiwan
-
 Tajikistan
-
 Tanzania
-
 Thailand
-
 Trinidad and Tobago
-
 Tunisia
-
 Turkey
-
 UAE
UAE
-
 Uganda
-
 Ukraine
-
 United Kingdom
-
United States
-
 Uruguay
-
 Uzbekistan
-
 Venezuela
-
 Vietnam
-
 Yemen
Yemen
-
 Zambia
-
 Zimbabwe
- Forex
- Crypto
