
Bit Digital stock price forecast: Downside risks persist as BTBT falls 3.24%

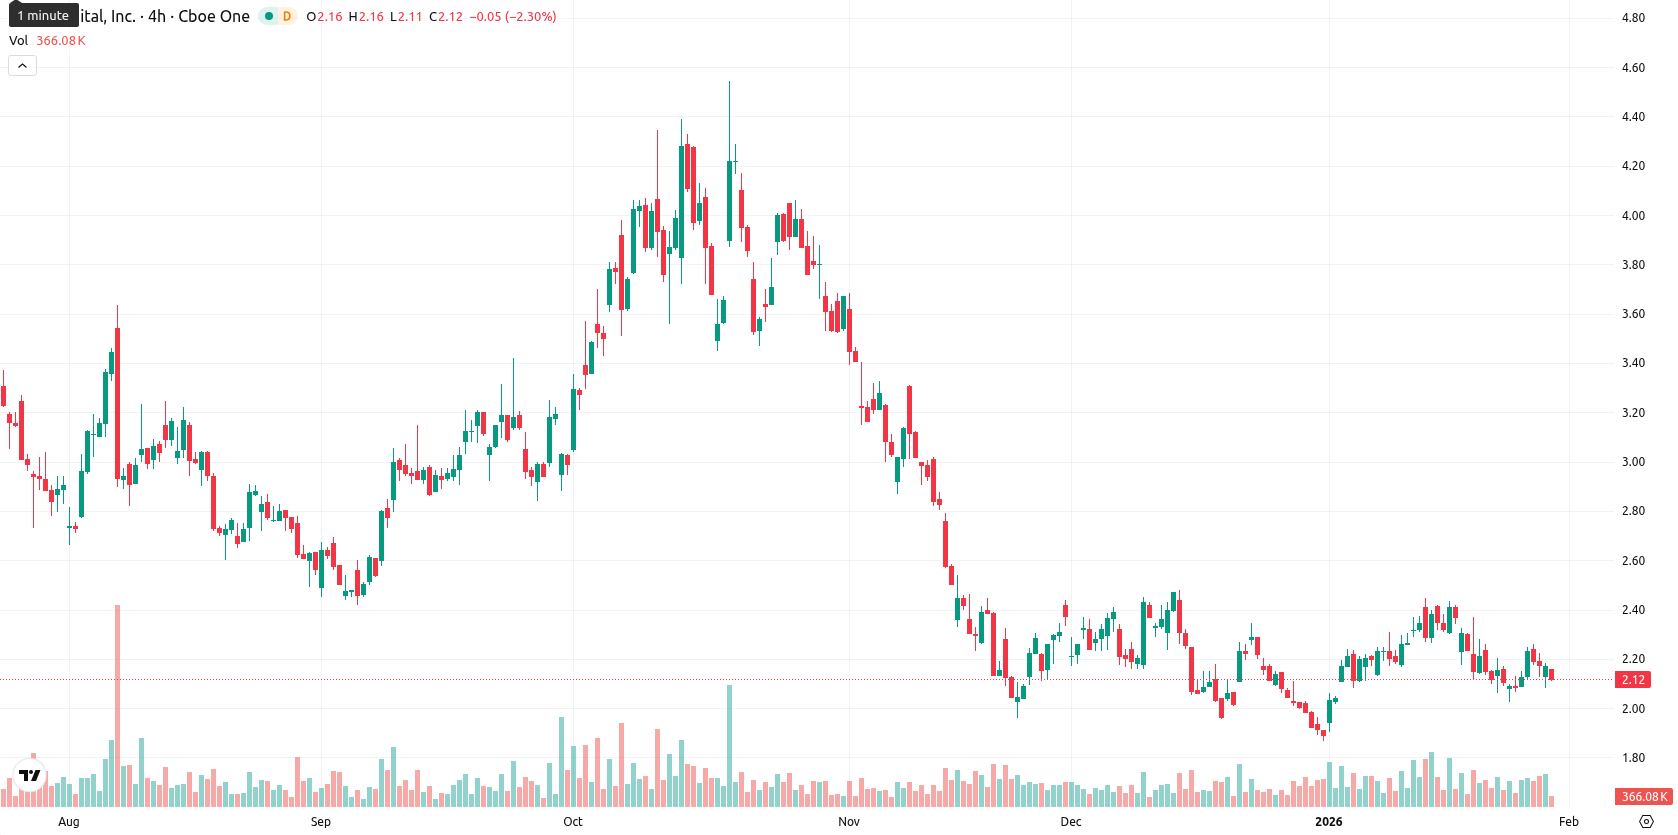
Bit Digital Inc (BTBT) is trading at $2.09, which is below the MA-20 ($2.18), MA-50 ($2.21), and MA-200 ($2.70) on the daily chart. This configuration signals short-term and medium-term selling pressure, and a persistently bearish long-term backdrop.
Highlights
- Bit Digital's annual shareholder letter emphasized its strategic investment in Ethereum infrastructure and reaffirmed a long-term stake in WhiteFiber.
- The company provided ongoing disclosures regarding Ethereum treasury positions and staking activities, underscoring the focus on equity holdings and digital asset operations.
- BTBT trades at $2.09, below all major moving averages, with a bearish technical outlook and resistance at $2.16–$2.21 and high risk of further decline.
Strategic focus on Ethereum supports long-term equity positioning
Bit Digital released its annual shareholder letter, detailing investment updates and its ongoing strategic focus on Ethereum infrastructure. The company reaffirmed its long-term stake in WhiteFiber and continued disclosures on Ethereum treasury and staking metrics, highlighting its strategy around equity holdings and digital asset operations.
Bearish momentum dominates as resistance forms and indicators weaken
The closest dynamic support is the Ichimoku Kijun at $2.16, which now acts as resistance, while further upside would meet resistance around the MA-50. Momentum indicators remain broadly negative: MACD points to continued weakness and ADX indicates a lack of clear trend. There are no signals of acute overbought or oversold conditions, as the RSI sits at 46.89 while the Stochastic RSI is neutral and CCI is flat. Bull/Bear Power registers a slight positive value, suggesting marginal buyer activity within the session, yet not enough to offset the broader downward trend. The Awesome Oscillator also remains in support of the prevailing bearish momentum. Today, the price slipped 3.24% with no gap between yesterday’s close ($2.16) and today’s open ($2.14). Currently, the price is near the lower end of today’s range ($2.08–$2.18) amid low to moderate intraday volatility. The tone has been weak, with sellers maintaining pressure after the open and intraday momentum signals confirming this downside action.
Sustained downside risk as technical signals flag limited upside
For the coming week, the expected price range is $1.85 to $2.35, based on current levels and adjusted for typical volatility. There is a very low probability (less than 20%) of a sustained price increase, given unanimous bearish or neutral signals from the weekly MACD, RSI, ADX, and Moving Averages. Conversely, the likelihood of a further decline is very high. The baseline scenario anticipates continued sideways movement within this corridor. A bullish case would require a firm push above $2.16 – $2.21 to challenge higher resistance, while a bearish scenario unfolds if sellers force a breakdown below the $1.90 area, targeting new lows.
Last time, analysts noted that Bit Digital Inc. is trading just above its short-term moving average but remains under medium- and long-term averages, reflecting a neutral to mildly positive short-term tone with persistent medium-term selling pressure. Momentum indicators, including a bearish MACD, weak ADX, and oversold oscillators, show mixed signals, with ongoing seller dominance and price action testing resistance near key technical levels.


Latest Bit Digital News


-
 Afghanistan
-
 Albania
-
 Algeria
-
 Angola
-
 Argentina
-
 Armenia
-
 Australia
-
 Austria
-
 Azerbaijan
-
 Bahamas
-
 Bahrain
-
 Bangladesh
-
 Belarus
-
 Belgium
-
 Bolivia
-
 Botswana
-
 Brazil
-
 Brunei
-
 Bulgaria
-
 Cambodia
-
 Cameroon
-
 Canada
-
 Chile
Chile
-
 China
China
-
 Colombia
-
 Congo
Congo
-
 Costa Rica
-
 Cote d'Ivoire
-
 Croatia
-
 Cuba
Cuba
-
 Cyprus
-
 Czechia
-
 DR Congo
-
 Denmark
-
 Dominican Republic
-
 Ecuador
-
 Egypt
Egypt
-
 El Salvador
-
 Estonia
-
 Eswatini
-
 Ethiopia
-
 Finland
-
 France
-
 Georgia
-
 Germany
-
 Ghana
Ghana
-
 Greece
-
 Haiti
Haiti
-
 Hong Kong
-
 Hungary
-
 India
India
-
 Indonesia
-
 Iran, Islamic republic
-
 Iraq
Iraq
-
 Ireland
-
 Israel
-
 Italy
Italy
-
 Jamaica
-
 Japan
Japan
-
 Jordan
-
 Kazakhstan
-
 Kenya
Kenya
-
 Korea
Korea
-
 Kuwait
-
 Kyrgyzstan
-
 Laos
Laos
-
 Latvia
-
 Lebanon
-
 Lesotho
-
 Libya
Libya
-
 Lithuania
-
 Luxembourg
-
 Madagascar
-
 Malaysia
-
 Malta
Malta
-
 Mauritius
-
 Mexico
-
 Moldova
-
 Mongolia
-
 Montenegro
-
 Morocco
-
 Mozambique
-
 Myanmar
-
 Namibia
-
 Nepal
Nepal
-
 Netherlands
-
 New Zealand
-
 Nigeria
-
 North Macedonia
-
 Norway
-
 Oman
Oman
-
 Pakistan
-
 Palestine
-
 Panama
-
 Papua New Guinea
-
 Paraguay
-
 Peru
Peru
-
 Philippines
-
 Poland
-
 Portugal
-
 Puerto Rico
-
 Qatar
Qatar
-
 Reunion
-
 Romania
-
 Rwanda
-
 Saudi Arabia
-
 Serbia
-
 Singapore
-
 Slovakia
-
 Slovenia
-
 Somalia
-
 South Africa
-
 Spain
Spain
-
 Sri Lanka
-
 Sweden
-
 Switzerland
-
 Syria
Syria
-
 Taiwan
-
 Tajikistan
-
 Tanzania
-
 Thailand
-
 Trinidad and Tobago
-
 Tunisia
-
 Turkey
-
 UAE
UAE
-
 Uganda
-
 Ukraine
-
 United Kingdom
-
United States
-
 Uruguay
-
 Uzbekistan
-
 Venezuela
-
 Vietnam
-
 Yemen
Yemen
-
 Zambia
-
 Zimbabwe
- Forex
- Crypto
